
ADT Inc.’s Transition to Platform-Centric Sales under Heavy Debt and Stable Cash Flow
ADT advances its ADT+ software-centric model amid evolving sales dynamics, substantial leverage, and steady recurring revenue.
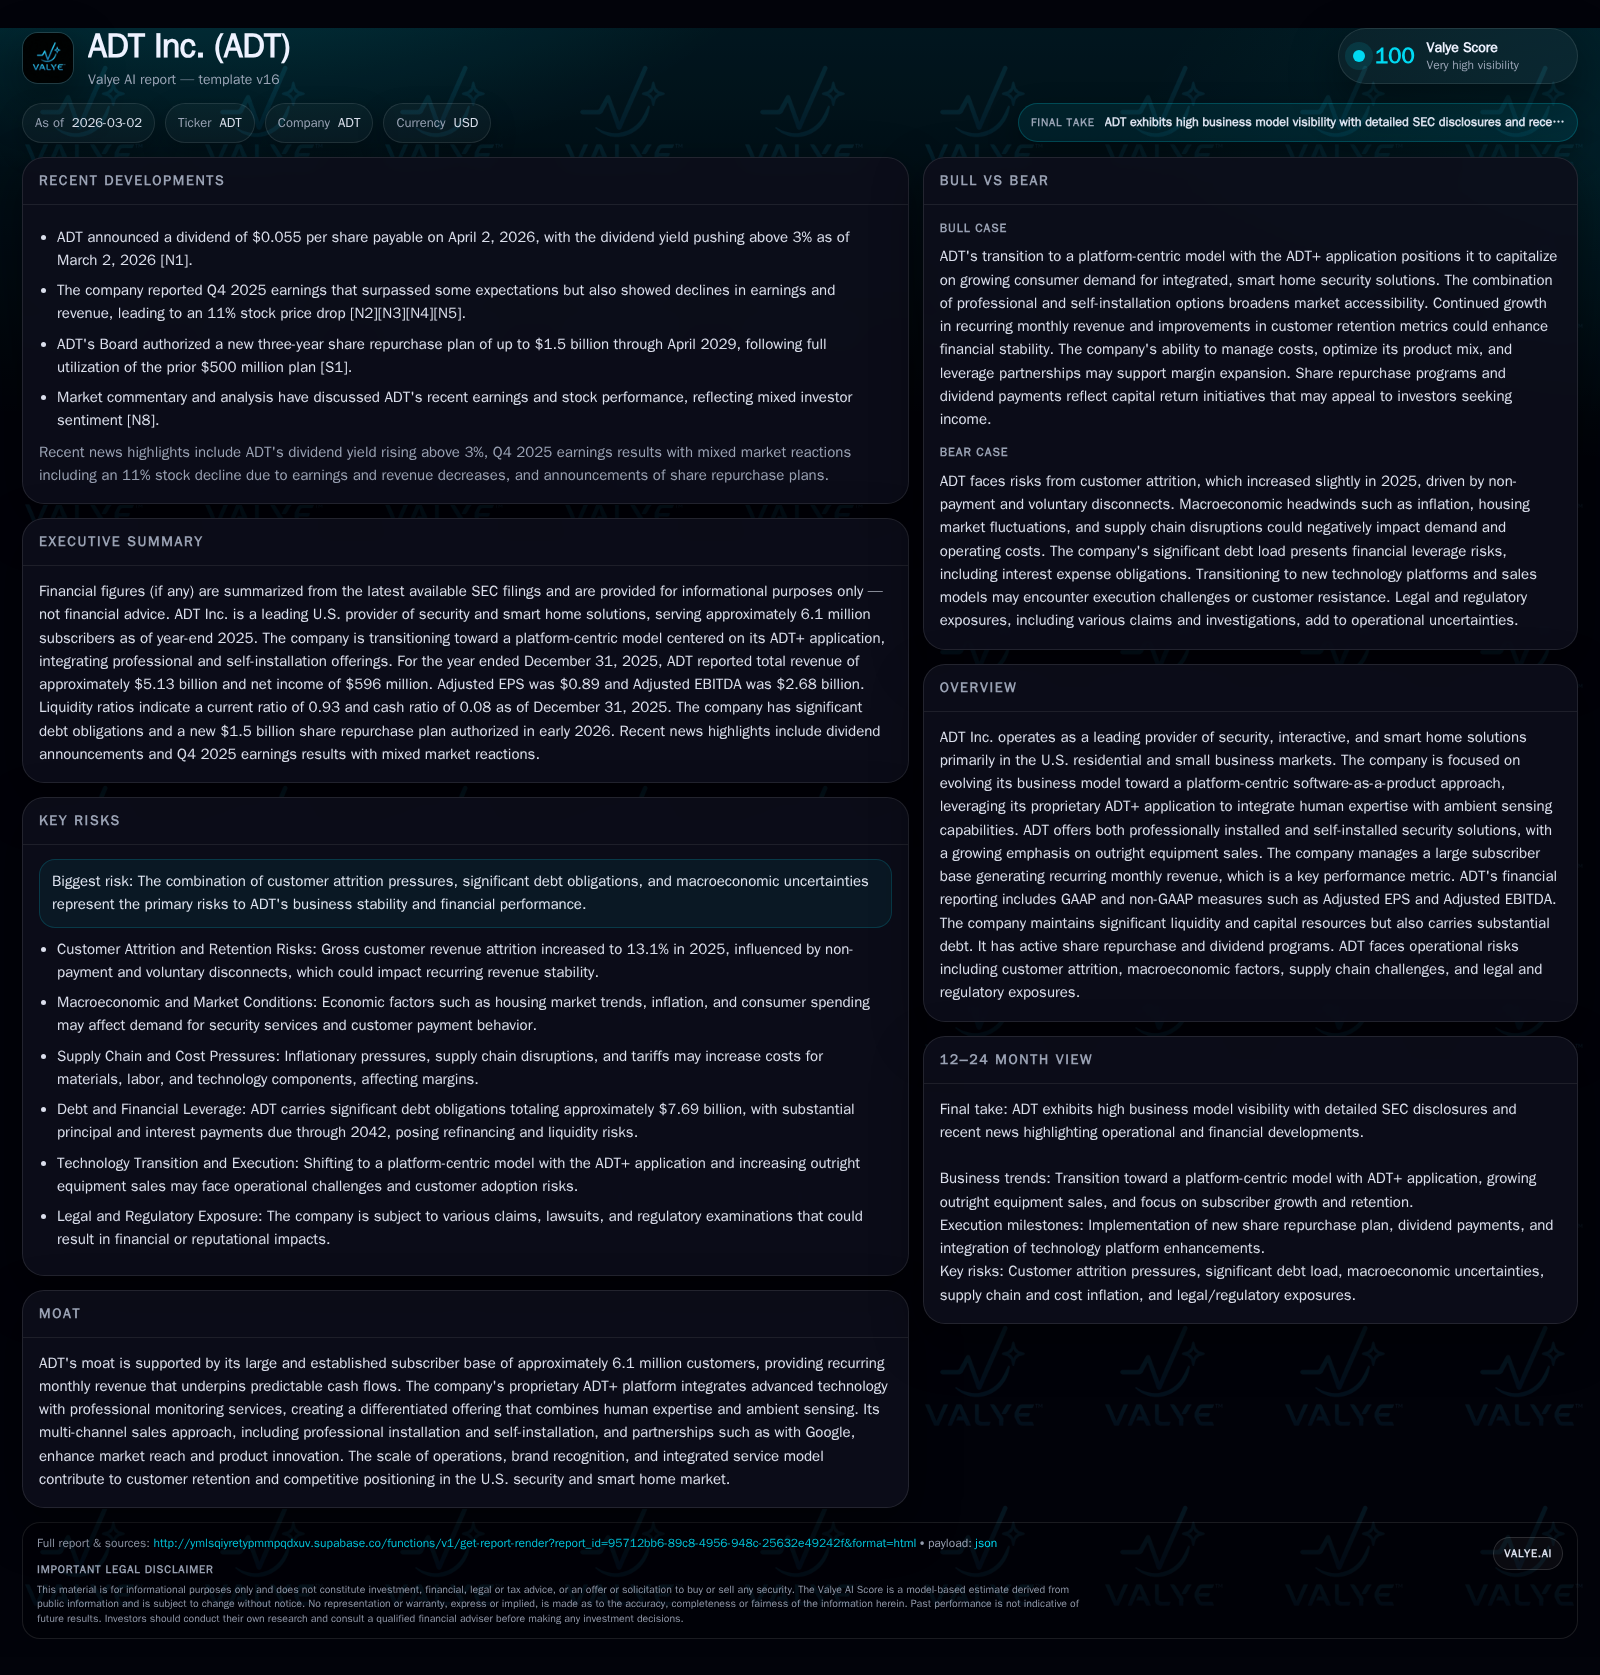
ADT Inc. remains a dominant player in U.S. residential and small business security markets, with a subscriber base of approximately 6.1 million generating consistent recurring monthly revenue. The company is shifting its business model toward a platform-driven approach centered around the proprietary ADT+ application, increasingly emphasizing outright equipment sales alongside traditional installation models. Despite robust operating income growth in 2025, driven partly by increased installation revenues and price adjustments, ADT carries significant long-term debt, requiring ongoing management of interest expenses and refinancing risks. Capital allocation reflects an active shareholder return policy with substantial buybacks and dividends, supported by strong operating cash flow.
Historical Performance and Growth Drivers
ADT Inc., a leading provider of security and smart home solutions primarily focused on the U.S. residential and small business segments, reported a sharp increase in operating income to approximately $1.31 billion for fiscal year 2025 from just over $305 million in 2024 according to its latest SEC filing [F1]. This outsized gain of nearly 329% year-over-year was fueled largely by higher installation revenues tied to both professional installations and an expanding outright equipment sales model under the ADT+ platform [S5][S19]. Net income also more than doubled to about $596 million from $190 million a year prior [F1]. These results reflect successful pricing adjustments—average prices increased materially in 2025—and higher volume of installations despite some offsetting volume declines impacting recurring monitoring services revenue (RMR), which remained essentially flat year-over-year at approximately $359 million per month [S9][S23].
Recurring monthly revenue derives from ADT's large installed base of roughly 6.1 million subscribers as of December 31, 2025 [S7][F1]. This sizable customer pool provides a core moat that supports predictable cash flows. However, gross customer attrition ticked up slightly to 13.1% from 12.7% in the previous year, driven by factors such as increased non-payment disconnects partially offset by fewer relocations reflecting housing market trends [S9]. Attrition dynamics remain important given the long-term subscriber commitment economics—the company typically breaks even on acquisition within about two years [S7].
ADT’s shift towards a platform-centric business model pivots on its ADT+ software ecosystem launched nationally in mid-2024, integrating human expertise with ambient sensing across both professionally installed and self-installed solutions [S5][S11]. By late 2025, approximately one-quarter of new direct channel subscribers purchased equipment outright rather than under traditional company-owned installment models [S5]. This transition impacts revenue recognition timing—security installation product revenues saw notable increases—as well as associated cost profiles [S19]. The move towards more self-installation options aligns with evolving consumer preferences but typically yields lower recurring fees compared to professional installs [S5].
Capital Allocation and Financial Position
Financially, ADT manages substantial leverage with total debt carrying approximately $7.69 billion at December 31, 2025 [F1][S16]. The company actively refinanced portions of its debt throughout 2025: notably issuing $1 billion aggregate principal amount of first lien notes due 2033 at a coupon near 5.875%, while redeeming earlier notes due in nearer terms using proceeds from term loans [S12][S18]. Scheduled amortizations on certain term loans commence March 2026 with voluntary prepayments permitted without penalty [S12][S22]. Interest expense remained significant at over $459 million net for the year but was well-covered by operating performance [F1][S19].
Liquidity remains healthy with cash and equivalents near $81 million complemented by roughly $800 million available under revolving credit facilities as of the end of 2025 [F1][S4]. In managing debt service obligations and working capital needs, ADT expects ongoing cash flow from operations—reported roughly flat year-over-year near $1.88 billion—to continue as the primary funding source alongside borrowing capacity if needed [F1][S4][S13]. Capital spending remained consistent with prior periods at approximately $176 million annually reflecting investments aligned with growing outright sale volumes reducing system asset outlays compared to prior periods [F1][S29].
Shareholder returns have been a clear focus recently with total dividends paid nearing $187 million during FY25 and share repurchases totaling approximately $607 million, marking a significant increase from prior years when repurchases were muted or absent [F1][S15]. Further affirming this trend, ADT announced a substantial new three-year share repurchase authorization capped at $1.5 billion through April 2029 shortly after the fiscal year-end reporting date in early March 2026 [N1][S3][S15]. This capital return activity underscores confidence in cash generation even amid macroeconomic uncertainties.
Industry Positioning and Strategic Considerations
ADT's competitive moat is substantially derived from its vast subscriber base providing stable monthly monitoring fees that anchor revenues against cyclical volatility prevalent elsewhere in consumer tech or hardware-led businesses. The integration of the ADT+ platform represents an ambitious technological pivot—leveraging AI-driven ambient sensing combined with human intervention to enhance real-time response capabilities—which may differentiate it further from commoditized DIY security providers while expanding reach through multiple go-to-market channels including e-commerce self-install options and retail partnerships [S11].
The strategic tradeoffs inherent in shifting toward more outright sales include foregoing some upfront subscription contract values balanced against increased flexibility for customers preferring ownership and possibly faster uplift from ancillary products or feature expansions delivered via software updates on the platform-centric model. As this transition proceeds beyond early-2026 with plans to broaden outright sales for certain non-ADT+ offerings as well [S5], monitoring impacts on retention metrics and RMR volatility will be critical.
Risks and Outlook Considerations
Key risks articulated by management center on attrition exacerbated by legacy system compatibility issues relative to ADT+, rising debt service demands amid sustained high leverage levels particularly if interest rates remain elevated, and broader macroeconomic conditions that could constrain discretionary consumer spending or worsen non-payment disconnects [S11]. Supply chain disruptions for key hardware components also remain monitored though current mitigation efforts appear effective without material adverse impacts reported yet [S11].
While explicit detailed multi-year guidance was not provided in recent public filings or earnings disclosures through March 2, 2026 [N1][N3][S3], milestones to monitor include subscriber net additions trends especially within outright sale cohorts, gross customer attrition rates relative to historical baselines near low teens percentages annually, further adoption progress of the ADT+ platform ecosystem across new installs versus legacy systems integration challenges, quarterly operating income trajectory sustaining recent gains, and liquidity positions supporting scheduled debt amortizations plus capital returns.
Summary Table: Annual Financial Highlights (USD thousands)
Historical performance (annual)
| FY | Net ($mm) | CFO ($mm) | OpInc ($mm) | Capex ($mm) | Net YoY |
|---|---|---|---|---|---|
| 2025 | 596 | 1884 | 1309 | 176 | +213.7% |
| 2024 | 190 | 1885 | 305 | 164 | -67.0% |
| 2023 | 576 | 1658 | 263 | 176 | +334.1% |
| 2022 | 133 | 1888 | 509 | 177 |
Source: SEC companyfacts cache [F1].
Capital returns and efficiency (annual)
| FY | Div ($mm) | Buybacks ($mm) | FCF ($mm) |
|---|---|---|---|
| 2025 | 187 | 607 | 1708 |
| 2024 | 182 | 241 | 1721 |
| 2023 | 129 | 0 | 1481 |
| 2022 | 127 | 1200 | 1711 |
Source: SEC companyfacts cache [F1].
*Certain figures for prior years shown for context but not discussed explicitly due to data limitations.
Note: Operating Income increased dramatically YoY driven mainly by revenue mix shift toward installation/product sales; cash flow remained stable supporting capex and distribution.
Disclaimer
This analysis is provided for informational purposes only based on publicly available filings and transcripts from Q4 earnings releases through early March 2026 ([N#],[S#],[F1]) without investment advice or recommendations concerning any securities mentioned herein.
Disclaimer: This is research-only, informational analysis and not investment advice. It may include AI-generated interpretation and general industry context. Always verify important details using primary sources.
Comments