
Sight Sciences Balances Innovation with Persistent Operating Losses and Market Adoption Challenges
Specialized ophthalmic device firm Sight Sciences continues to invest in product development while facing reimbursement, supply chain, and profitability pressures.
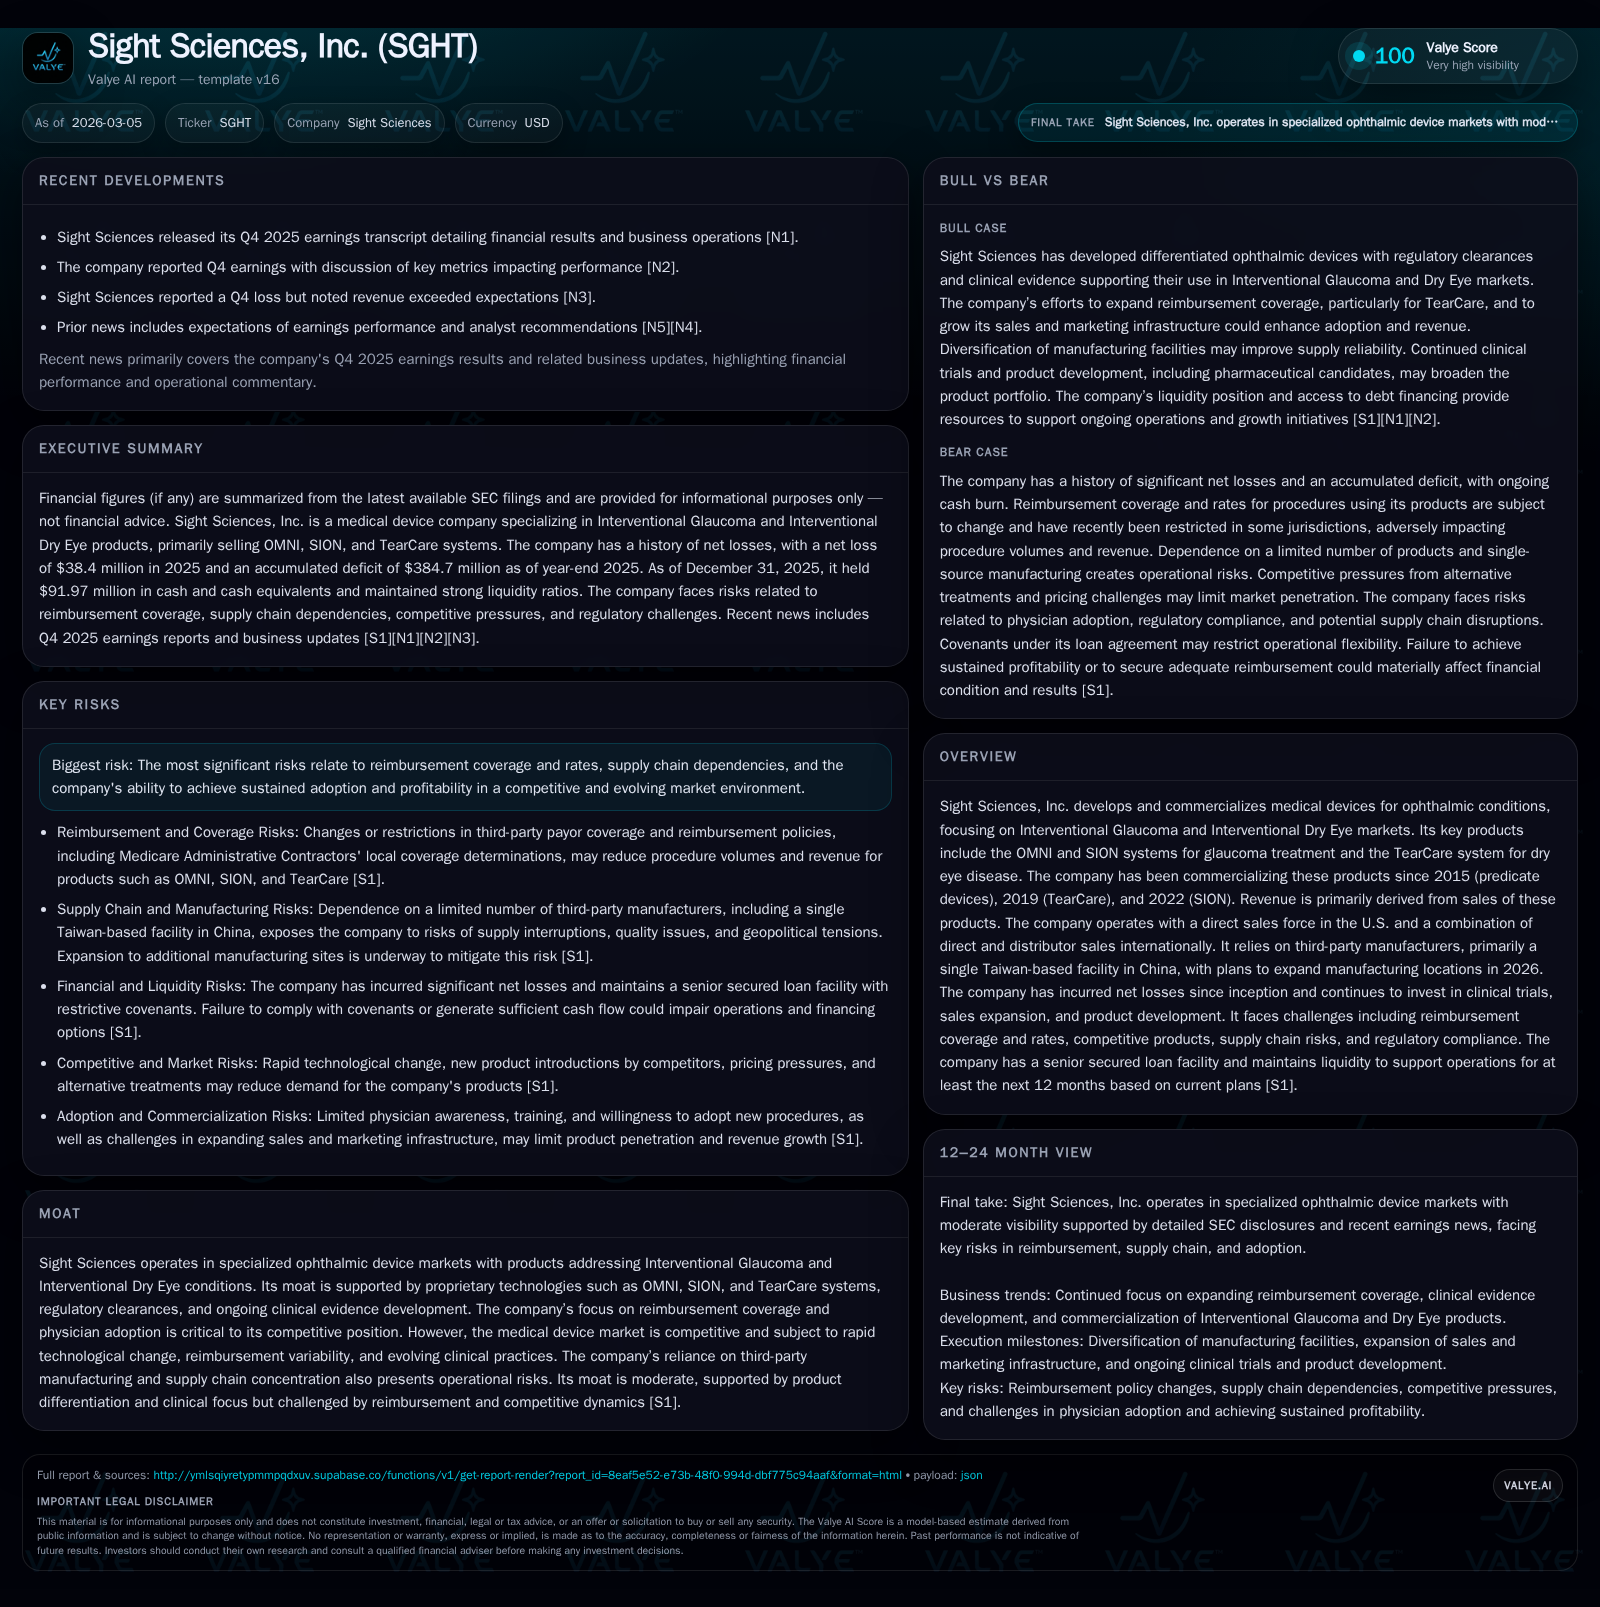
Sight Sciences, Inc. develops proprietary devices targeting interventional glaucoma and dry eye markets with flagship products including OMNI, SION, and TearCare. Since inception, the company has operated at a loss, driven by heavy investments in clinical trials, sales expansion, and regulatory initiatives. Revenue growth hinges on broader physician adoption and expanded reimbursement coverage, especially for TearCare. While operating losses narrowed in 2025 compared to prior years, cash flow remains negative, reflecting ongoing investment needs. Operational risks stem from concentrated third-party manufacturing and competitive market dynamics.
Company Overview
Sight Sciences, Inc., established in 2010, specializes in the development and commercialization of medical devices addressing ophthalmic disorders, specifically interventional glaucoma and dry eye disease. Its commercial portfolio centers around three key technologies: the OMNI system and the newer SION system targeting glaucoma treatments; along with the TearCare system aimed at interventional dry eye therapy. Product introductions occurred progressively over the past decade: predicate glaucoma devices dating back to 2015 evolved into OMNI; TearCare launched commercially in 2019; while SION was introduced recently in 2022 [S1].
The company's revenue streams are exclusively tied to these product sales. Sales are conducted via a direct sales force within the United States complemented by distributor partnerships internationally. Manufacturing is outsourced primarily to a single contract facility located in Taiwan (within China), creating production concentration risk that the firm aims to mitigate with diversification plans slated for 2026 [S1].
Historical Financial Performance
Since its inception, Sight Sciences has remained unprofitable while heavily investing in research and development (R&D), clinical validation programs to cement safety/efficacy data for regulatory agencies and payors, as well as expanding commercial footprint [S1]. The company’s net losses have been persistent albeit gradually improving.
Financial highlights over recent years illustrate this trend clearly:
Historical performance (annual)
| FY | Net ($mm) | CFO ($mm) | OpInc ($mm) | Capex ($) | Net YoY |
|---|---|---|---|---|---|
| 2025 | -38 | -30 | -37 | 224000 | +25.4% |
| 2024 | -52 | -22 | -51 | 385000 | +7.3% |
| 2023 | -56 | -47 | -57 | 791000 | +35.6% |
| 2022 | -86 | -76 | -84 | 970000 |
Source: SEC companyfacts cache [F1].
Capital returns and efficiency (annual)
| FY | FCF ($mm) | ROE% |
|---|---|---|
| 2025 | -30 | -60.1 |
| 2024 | -23 | -58.8 |
| 2023 | -48 | -46.2 |
| 2022 | -77 | -53.9 |
Source: SEC companyfacts cache [F1].
Operating income improved by roughly 26.6% from a loss of $50.5 million in FY24 to a loss of $37.1 million in FY25 [F1]. Net income trends similarly saw a roughly 25% reduction in losses during this period.
Cash flow from operations remained negative but showed improvement from the previous years (-$29.7M vs -$22.3M year-over-year decline likely due to operational changes). Capital expenditures have been minimal (under $1 million annually), underscoring a focus on less capex-intensive activities such as R&D, clinical trials, marketing programs and intellectual property pursuits [F1].
Drivers of Past Performance
- Heavy R&D spend fueled by continuous clinical studies aimed at growing payer coverage and physician acceptance.
- Expansion of direct sales capabilities domestically supported by distributor networks internationally.
- Ongoing litigation related to intellectual property which adds to legal expenses.
- Investments into regulatory compliance infrastructure and quality management systems critical for FDA clearance maintenance.
- Product launches staggered over several years have limited immediate revenue scale but set groundwork for future adoption.
- Supply chain vulnerability due to reliance on one major outsourced contract manufacturer.
Growth Prospects
Future revenue growth fundamentally depends on several critical factors:
- Expansion of Reimbursement: Achieving broader coverage especially for TearCare procedures beyond initial jurisdictions like FCSO and Novitas is paramount [S29]. This directly correlates with patient access and procedure uptake.
- Physician Adoption: Increasing the penetration rate within physicians performing interventions using OMNI/SION technology will drive glaucoma-related revenue growth.
- Product Innovation: Continued development pipeline including enhancement of existing devices or novel product introductions aligned with clinical needs is essential.
- Geographic Expansion: Growing international presence beyond current distributor-led channels through direct sales or partnerships extends market reach.
- Operational Scaling: Mitigating supply chain bottlenecks through manufacturing diversification will support higher volumes.
Constraints that could temper growth include the variability of reimbursement rates across payors and regions; market competition from alternative therapies or new entrants; regulatory hurdles delaying product approvals or label expansions; potential adverse outcomes from ongoing patent litigations affecting freedom-to-operate; and execution risks associated with scaling manufacturing or sales organizations [S1][S4][S7][S29].
Forecasts & Milestones to Watch
While explicit future guidance is not detailed in filings or news releases as of the latest annual report ([N1], [S3]), key developments to monitor include:
- Coverage decisions by additional Medicare Administrative Contractors or commercial insurers impacting TearCare procedure reimbursements.
- Clinical trial readouts or registries affirming long-term safety/efficacy that can enhance payer/reimbursement negotiations.
- Progress against patent litigation relating to foundational technology which might influence competitive positioning / licensing revenues.
- Expansion announcements regarding new manufacturing facilities impacted by diversification efforts scheduled for 2026.
- Changes in operating cost structure from scaling sales headcount or supply chain restructuring impacting profitability outlook.
As these milestones unfold, their outcome will substantially shape near-term revenue trajectory and margin improvements.
Returns & Capital Allocation
Return metrics remain negative given ongoing unprofitability: return on equity approximated -60.1% based on FY25 figures (-$38M net loss against $64M equity) indicating substantial capital invested without earnings generation yet [F1].
Capital expenditure is modest relative to cash burn suggesting allocated spending prioritizes clinical development rather than fixed asset additions.
Liquidity sits at approximately $92 million cash equivalents as of December 31, 2025 providing runway exceeding one year when combined with debt facilities subject to covenant compliance conditions [F1][S8][S29]. The company carries about $40 million in principal borrowings under a senior secured credit agreement with Hercules Capital bearing an interest rate floor around 10%, imposing notable interest expense (~$5 million annually) thereby stressing free cash flow generation corridors [F1][S27][S15].
No dividend payments or share repurchases have been reported consistent with reinvestment into growth initiatives amid loss-making status [F1].
Industry Context Analysis
Interventional glaucoma devices represent a niche but growing segment influenced heavily by patient demographic trends such as aging populations increasing glaucoma prevalence globally. Competition includes both similar micro-invasive glaucoma surgery (MIGS) device companies as well as legacy surgical options posing therapeutic alternatives.
Dry eye treatment innovation is evolving swiftly incorporating pharmaceutical adjuncts alongside device-based approaches like TearCare’s thermal pulsation mechanism addressing underlying meibomian gland dysfunction better than traditional over-the-counter therapies.
Reimbursement complexity is typical for ophthalmic devices requiring robust health economics evidence demonstrating procedure cost-effectiveness relative to standard care before widespread payer adoption occurs — this lag delays peak market penetration especially in heterogeneous US regional Medicare reimbursements scenarios .
Supply chains are often sensitive due to specialized materials/components needing qualification under stringent FDA quality standards linking manufacturing reliability directly with regulatory compliance requirements seen broadly in medtech sectors .
Litigation risk remains endemic given the escalating pace of IP disputes among device innovators aiming to protect market share or extract royalties particularly where patent portfolios overlap within advanced MIGS technologies .
Conclusion
Sight Sciences substantiates itself as an innovative player targeting high-value ophthalmic indications with differentiated products supported by intellectual property protections supplemented by ongoing clinical trial investments driving reimbursement discussions essential for commercial success. The company’s financial history reveals persistent losses rooted in aggressive growth-driving expenditures coupled with large-scale operational ramp-ups including regulatory compliance burdens.
While recent years show improving operating losses accompanied by stable liquidity providing cushion against near-term funding concerns, structural profitability remains elusive due mainly to reimbursement variability risk compounded by concentrated supplier relationships creating production vulnerabilities.
Monitoring developments on reimbursement expansions especially for TearCare usage along with intellectual property litigation outcomes will be critical barometers of future financial viability alongside progress executing planned manufacturing diversification strategies mitigating operational risks.
Disclaimer: This analysis is intended solely for informational purposes based on publicly available filings and news sources as of March 2026. It does not constitute investment advice or recommendations regarding any security or issuer mentioned herein.
Disclaimer: This is research-only, informational analysis and not investment advice. It may include AI-generated interpretation and general industry context. Always verify important details using primary sources.
Comments