
CompX International Inc. Delivers Strong Operating Income Growth Amid Mixed Revenue Trends
CompX International's dual-segment manufacturing approach in Security Products and Marine Components supports stable operations and robust profitability despite revenue fluctuations in 2025.
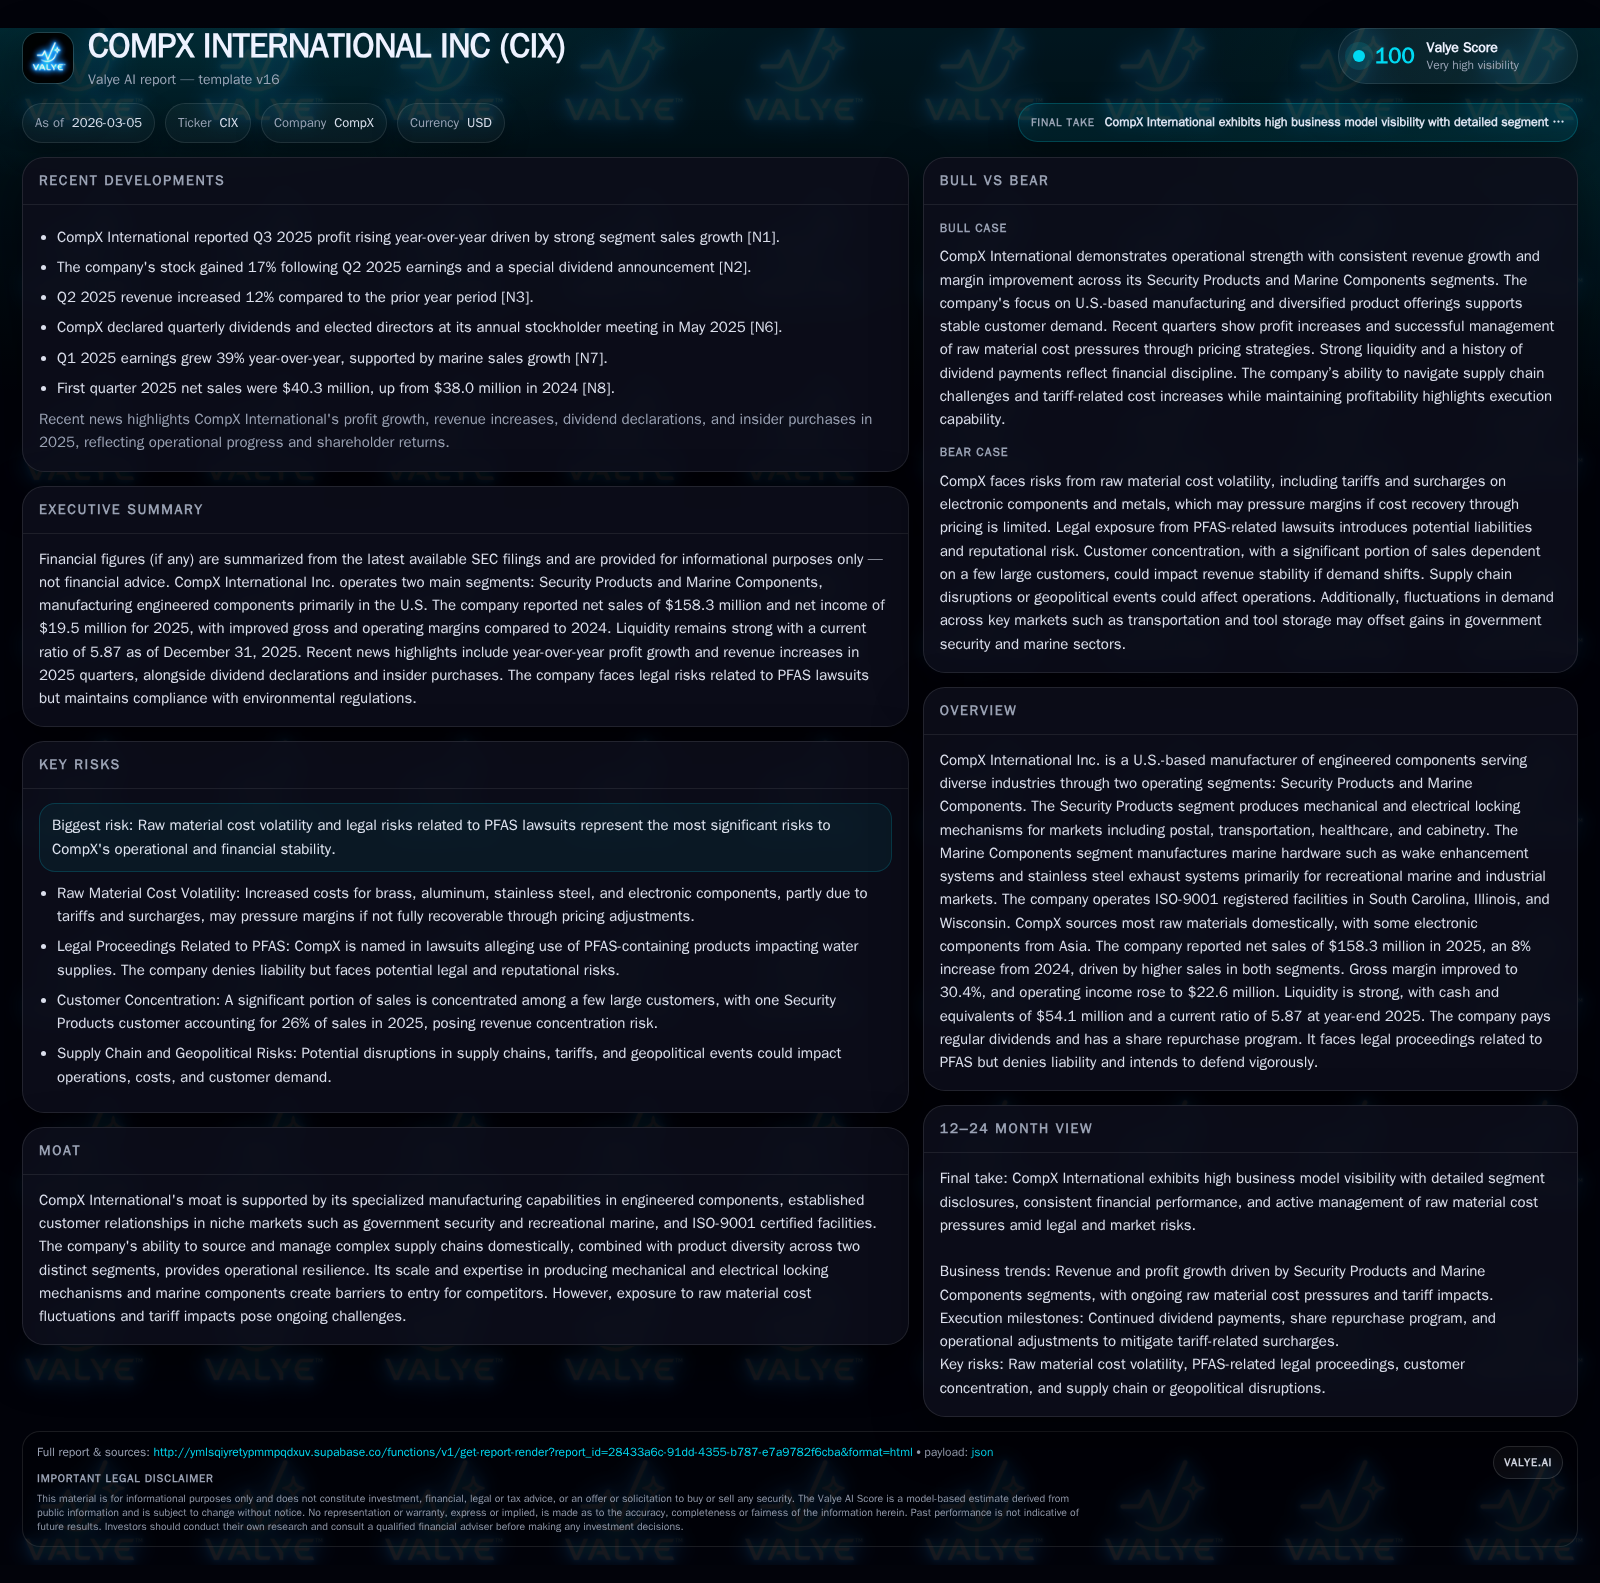
In fiscal 2025, CompX International Inc. reported operating income growth of nearly 33% to $22.6 million, driven by improved margins and operational leverage across its Security Products and Marine Components segments. While net sales declined slightly year-over-year to $158.3 million, reflecting mixed demand conditions, the company sustained strong operating cash flow near $22.9 million and increased capital expenditures to $3.7 million to support capacity and maintenance. Capital allocation favored shareholder returns with consistent dividends supplemented by special payouts, while share repurchases remained authorized but inactive. Legal risks from PFAS-related litigation persist, though no losses have been accrued and the company continues vigorous defense efforts. CompX's manufacturing facilities remain ISO-9001 certified with a predominantly domestic supply chain mitigating some raw material cost pressures amid tariff challenges.
Historical Financial Performance Overview
CompX International Inc.'s financial results for fiscal year 2025 reflect resilience in profitability despite a modest decline in net sales compared to the prior year. Net sales totaled approximately $158.3 million in 2025, down about 4.6% year-over-year [F1]. Operating income rose substantially by 32.8% to $22.6 million on improved gross margins of roughly 30.4%, driven by favorable product mix shifts and enhanced fixed cost leverage across both operating segments [F1], [S23]. Net income increased 17.4% to $19.5 million, sustaining positive earnings momentum [F1]. Meanwhile, operating cash flow remained steady at approximately $22.9 million despite fluctuations in working capital components [F1]. Capital expenditures increased meaningfully to about $3.7 million as investments were made primarily to meet existing demand and maintain facilities [F1], [S4], [S25].
Historical performance (annual)
| FY | Net ($mm) | CFO ($mm) | OpInc ($mm) | Capex ($mm) | Net YoY |
|---|---|---|---|---|---|
| 2025 | 19 | 23 | 23 | 4 | +17.4% |
| 2024 | 17 | 23 | 17 | 1 | -26.6% |
| 2023 | 23 | 26 | 25 | 1 | +8.3% |
| 2022 | 21 | 17 | 25 | 4 |
Source: SEC companyfacts cache [F1].
Capital returns and efficiency (annual)
| FY | Div ($mm) | Buybacks ($) | FCF ($mm) |
|---|---|---|---|
| 2025 | 27 | 19 | |
| 2024 | 39 | 1744000 | 22 |
| 2023 | 12 | 1744000 | 25 |
| 2022 | 34 | 1744000 | 13 |
Source: SEC companyfacts cache [F1].
*Note: Revenue figures for prior years are proxied using segment data from SEC filings [S8].
Segment Analysis: Security Products and Marine Components
CompX operates through two reportable segments: Security Products and Marine Components [S6]. The Security Products segment manufactures locking mechanisms and related security devices primarily serving government security markets alongside postal, transportation, cabinetry, healthcare, and tool storage sectors [S6], [S16]. This segment accounted for approximately $120 million of net sales in fiscal year 2025, maintaining steady demand particularly from government contracts despite softness in transportation and distribution end markets [S16].
The Marine Components segment produces marine hardware including wake enhancement systems, stainless steel exhaust systems, gauges, throttle controls, trim tabs and related accessories mainly for recreational marine customers [S6]. In fiscal year 2025, this segment reported net sales near $37.6 million supported by higher government and industrial market orders as well as a one-time stocking event for a towboat OEM early in the year [S16]. Both segments operate out of ISO-9001 certified manufacturing facilities located in South Carolina, Illinois (shared), and Wisconsin [S6].
Profitability Drivers and Cost Environment
Gross margin improvement to around 30.4% was propelled by an improved product mix favoring higher-margin offerings within the Security Products segment alongside greater fixed cost absorption due to increased volumes across both divisions [F1], [S23]. However, tariff-related surcharges on electronic components—primarily imported from Asia—introduced input cost pressures starting mid-2025 that CompX is addressing through selective price increases though full pass-through remains uncertain given competitive market dynamics [S15], [S16]. Operating expenses increased moderately reflecting inflationary wage pressures but were offset by revenue gains resulting in expanded operating leverage [S23].
Liquidity Position and Capital Allocation
As of December 31, 2025, CompX held approximately $54 million in cash and equivalents providing ample liquidity for near-term operational needs and capital projects [F1], [S13]. The company generated roughly $22.9 million of operating cash flow during the fiscal year which comfortably funded capital expenditures of $3.7 million aimed at sustaining production capabilities along with regular dividend payments totaling about $14.8 million plus special dividends aggregating approximately $12.3 million paid across recent years [F1], [S7], [S12], [S13].
Despite board authorization for stock repurchases with over half a million shares available under the program at year-end, no repurchases occurred during fiscal years 2023 through 2025 reflecting management’s preference for dividend returns amid uncertain external conditions including litigation risks [S7], [F1].
Legal Risks: PFAS Litigation
CompX is subject to consolidated lawsuits alleging use of PFAS chemicals potentially impacting water supplies near manufacturing sites; however, the company denies regulatory violations or direct liability and has not recognized any loss contingencies given current assessments of probability or magnitude of potential damages [S1], [S14], [S20]. Management continues to vigorously defend against these claims while monitoring developments.
Outlook Considerations
While explicit forward guidance is limited within recent SEC disclosures, key factors influencing CompX’s near-term outlook include stability of government contract demand within Security Products; continued recovery in Marine Components’ industrial and government orders; effective management of raw material cost inflation including tariffs; resolution or mitigation of PFAS legal risks; along with disciplined capital expenditure execution supporting incremental growth without excessive leverage or dilution risk [S15], [S16], [S25].
This analysis synthesizes CompX International Inc.'s publicly filed financial statements through fiscal year-end December 31, 2025 alongside management commentary extracted from SEC filings to provide a comprehensive view of its operational performance, capital deployment strategy, segment dynamics, and risk profile.
Disclaimer: This document is prepared solely for informational purposes based on publicly available data without investment advice or recommendations regarding CompX International Inc.
Disclaimer: This is research-only, informational analysis and not investment advice. It may include AI-generated interpretation and general industry context. Always verify important details using primary sources.
Comments