
Air Products Advances Core Industrial Gases and Clean Hydrogen amid Portfolio Realignment
Air Products & Chemicals, Inc. reports sequential revenue growth and profitability recovery in Q2 2026, driven by operational focus and strategic execution.
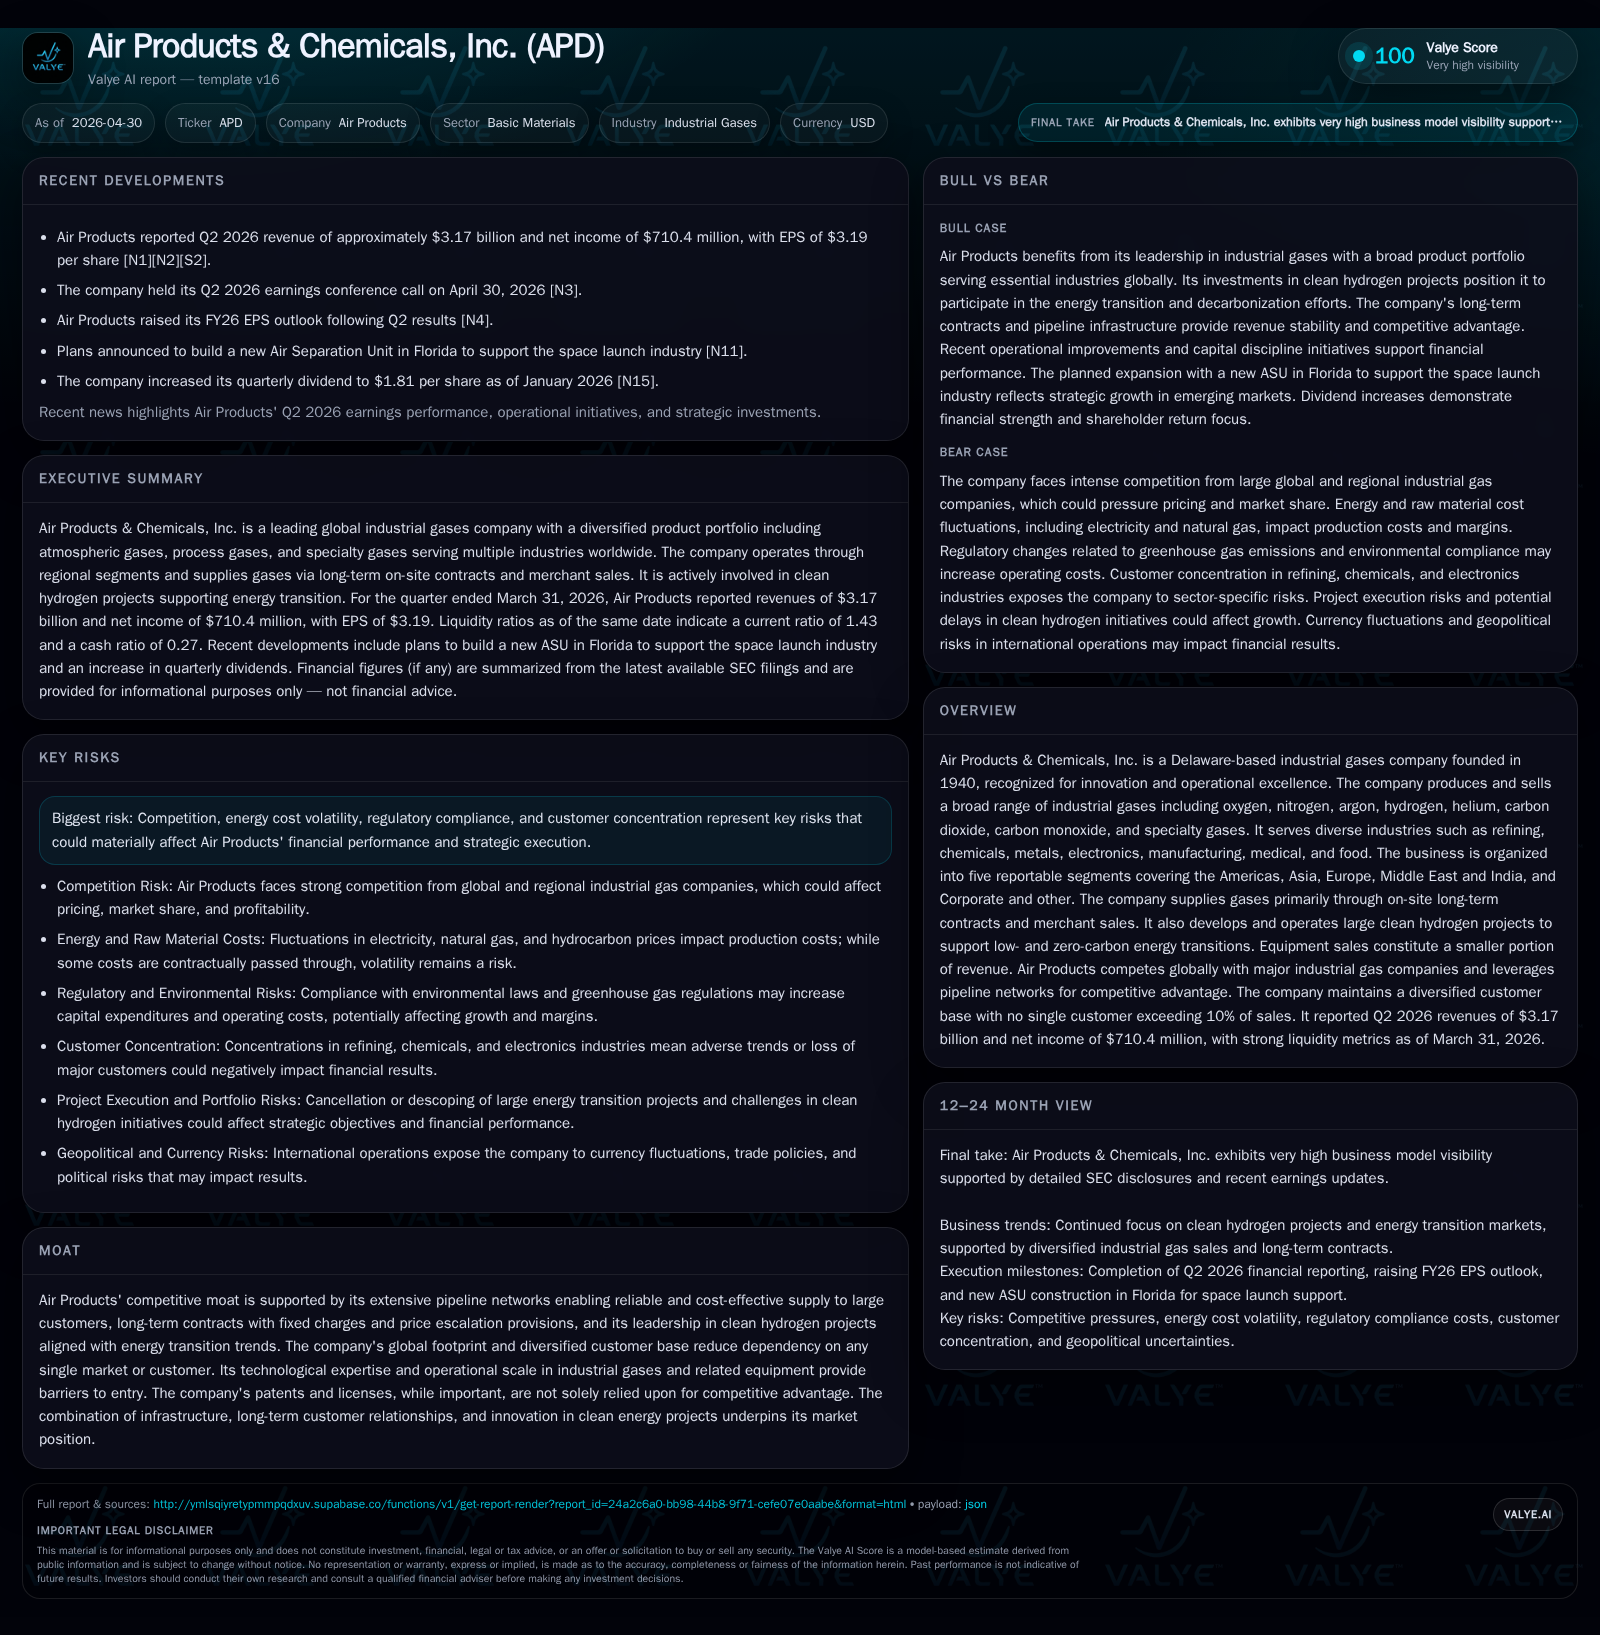
In its latest quarterly filing for Q2 2026, Air Products & Chemicals, Inc. demonstrated solid revenue growth to $3.17 billion and returned to operating profitability after a prior loss year, reflecting the company’s sharpened focus on core industrial gases and disciplined portfolio management. The firm’s business model leverages long-term contracts and extensive pipeline infrastructure across global regions, supporting diversified demand from refining, chemicals, metals, electronics, medical, and food industries. Strategic emphasis on clean hydrogen projects aligns with energy transition trends though risks remain from competition and market cyclicality. Monitoring project execution and cost inflation navigations will be critical to sustaining margin improvement.
Recent Operating Update
Air Products & Chemicals reported Q2 fiscal 2026 results on April 30, 2026 ([S2]). The company posted revenue of $3.17 billion for the quarter ended March 31, up from $2.92 billion in the same period last year. Cost of sales rose moderately to $2.18 billion but strong pricing power helped return operating income to positive territory at $753 million compared to a loss of $2.33 billion the previous year. For the six months ended March 31, revenues reached $6.27 billion versus $5.85 billion with operating income of approximately $1.49 billion recovering from a loss of nearly $1.68 billion year-over-year ([S2]).
This earnings rebound follows the transformational portfolio reshaping completed through fiscal 2025 under new CEO leadership ([S1]). That year was marked by divestitures including an LNG technology sale and major write-downs totaling about $3 billion related to exiting certain energy transition clean energy projects deemed non-core ([S1]). These decisive actions sharpened Air Products’ focus on its core industrial gases markets while maintaining leadership in viable clean hydrogen ventures.
Liquidity remains strong with cash and cash equivalents standing at $951 million as of March 31, down from $1.86 billion last September but current assets comfortably exceed current liabilities (current ratio ~1.43), underpinning operational flexibility ([S2],[F1]). Total debt remains elevated near $18 billion but includes project-financed arrangements that are largely nonrecourse ([F1],[S4]).
Business Model
Air Products generates revenue primarily by producing and supplying atmospheric gases (oxygen, nitrogen, argon) and process gases (hydrogen, helium, carbon monoxide/ dioxide) along with specialty gases to a diverse industrial customer base including refining, chemicals, metals processing, electronics manufacturing, medical sectors and food processing ([S1]).
The business segments correspond geographically—Americas; Asia; Europe; Middle East & India—as well as a corporate segment encompassing equipment sales like turbomachinery and cryogenic containers plus global management costs ([S1],[S22]).
Revenue streams break down into:
- On-site supply: About half the business is through long-term contracts where Air Products operates production plants on customer premises or nearby sites; these contracts typically include fixed charges plus provisions allowing escalation tied to energy costs.
- Merchant sales: The remainder comes through traditional merchant distribution channels delivering standardized gases.
- Equipment sales: Smaller contributor but strategically important to support specialized applications.
Margins benefit from contracted price escalators linked to energy inputs protecting profitability against cost inflation while infrastructure scale like pipeline networks provides delivery reliability at lower relative costs than competitors (). Their engineering and operational expertise support integration with large-scale customers reducing switching risks.
An important strategic vertical is clean hydrogen production tied to decarbonization initiatives in industrial processes and heavy transport (e.g., green/blue hydrogen projects). While historically representing a minor portion of revenue compared to legacy gases, this segment reflects Air Products' alignment with emerging sustainability-driven demand ([S1],).
Industry Structure & Competitive Position
The industrial gases sector is oligopolistic globally with few major players: Air Products stands alongside Linde plc, Air Liquide S.A., Messer Group GmbH among others competing through scale economies, customer contracts longevity, technological know-how, infrastructure investments (pipelines/plants), and innovation.
Air Products' competitive moat derives mainly from:
- Extensive proprietary pipeline networks enabling cost-effective continuous supply,
- Long-term contractual frameworks for stable recurring revenues,
- Technological leadership particularly in cryogenic gas production/equipment,
- Early mover advantage in clean hydrogen projects offering scalable solutions for low-carbon transitions.
Geographic diversification across roughly 50 countries also mitigates risk concentration while their joint ventures/affiliate structure supplements reach especially in emerging markets ([S1],[S22]).
However competitors continuously invest in capacity expansion and technology advancements challenging market share preservation which demands ongoing capital discipline ().
Growth Drivers
Key levers underpinning growth include:
- Clean Hydrogen Development: Positioned as a leader in large-scale green/blue hydrogen plants supporting clients' net-zero ambitions creates significant demand pipeline though projects typically entail multi-year development cycles (,[N14]).
- Industrial Recovery: As sectors like chemicals manufacturing rebound post-global economic headwinds driven by macro cycles, demand for fundamental industrial gases grows structurally.
- Innovation & Equipment Sales: Advancements in specialty gas applications for electronics fabrication or medical uses sustain incremental demand; new ASUs (air separation units) built at sites such as Florida respond to niche industry needs like space launch support ([N10],[N14]).
- Contract Pricing Dynamics: Energy cost passthrough mechanisms embedded provide margin protection enhancing overall returns during inflationary phases.
Expanding geographic presence especially in emerging economies represents additional upside given rising industrialization trends there ([S1],[S22]).
Risks / Watchpoints / Growth Constraints
- Competitive Intensity: Rivalries among dominant gas suppliers could pressure volumes or margins if not managed prudently.
- Energy Price Volatility: Despite contractual pass-throughs some lag effects or contract renewals at lower tariff levels can erode margins temporarily (,[S7],[S8]).
- Regulatory Environment: Compliance costs across multiple regions add complexity; environmental regulations impact plant operations especially for legacy fossil-linked technologies [S7].
- Customer Concentration: Large customers represent significant portions of revenues making operational disruptions or contract non-renewals impactful (,[S22]).
- Project Execution Risk: Clean hydrogen facilities are capital intensive with technical complexity; delays or cost overruns can impair returns (,[S1]).
- Economic Cyclicality: Industrial gas demand partly correlates with global economic health; downturns reduce volumes negatively affecting utilization rates.
What to Watch Next
Key near-term milestones include:
- Updates on backlog conversion for announced clean hydrogen projects reflecting order book health.
- Quarterly margin performance revealing ability to navigate input cost inflation besides volume/price mix gains.
- Progress on commissioning new capacity like Florida ASU supporting specialty gas segments ([N10],[N14]).
- Management commentary on capital expenditure plans aligned with strategic priorities following portfolio pruning completed last fiscal year.
- Developments concerning geopolitical or regulatory changes influencing operations in foreign subsidiaries are important given wide international footprint ([S1],).
Financial Profile Snapshot (Q2 FY26 Ending March 31)
Latest financial snapshot
This balance sheet positioning denotes manageable liquidity coverage for near-term obligations despite elevated leverage largely attributable to project financing structures that are non-recourse ([F1],[S2],[S4]). Operational cash flow improvements amid profitability recovery have enhanced free cash generation potential which management signals will be deployed cautiously governed by disciplined capital allocation principles established recently ([S1]).
Disclaimer
This analysis uses data sourced exclusively from SEC filings, validated financial metrics [F1], and relevant news reports as provided. It reflects factual corporate disclosures up to April 30, 2026 without extrapolation beyond stated information or offering investment advice.
Disclaimer: This is research-only, informational analysis and not investment advice. It may include AI-generated interpretation and general industry context. Always verify important details using primary sources.
Comments