
BGC Group’s Surge in 2025 Revenue and the Shifting Brokerage Technology Frontier
BGC Group delivered a remarkable 30% revenue increase in 2025, underscoring the transformation of brokerage through integrated electronic platforms.
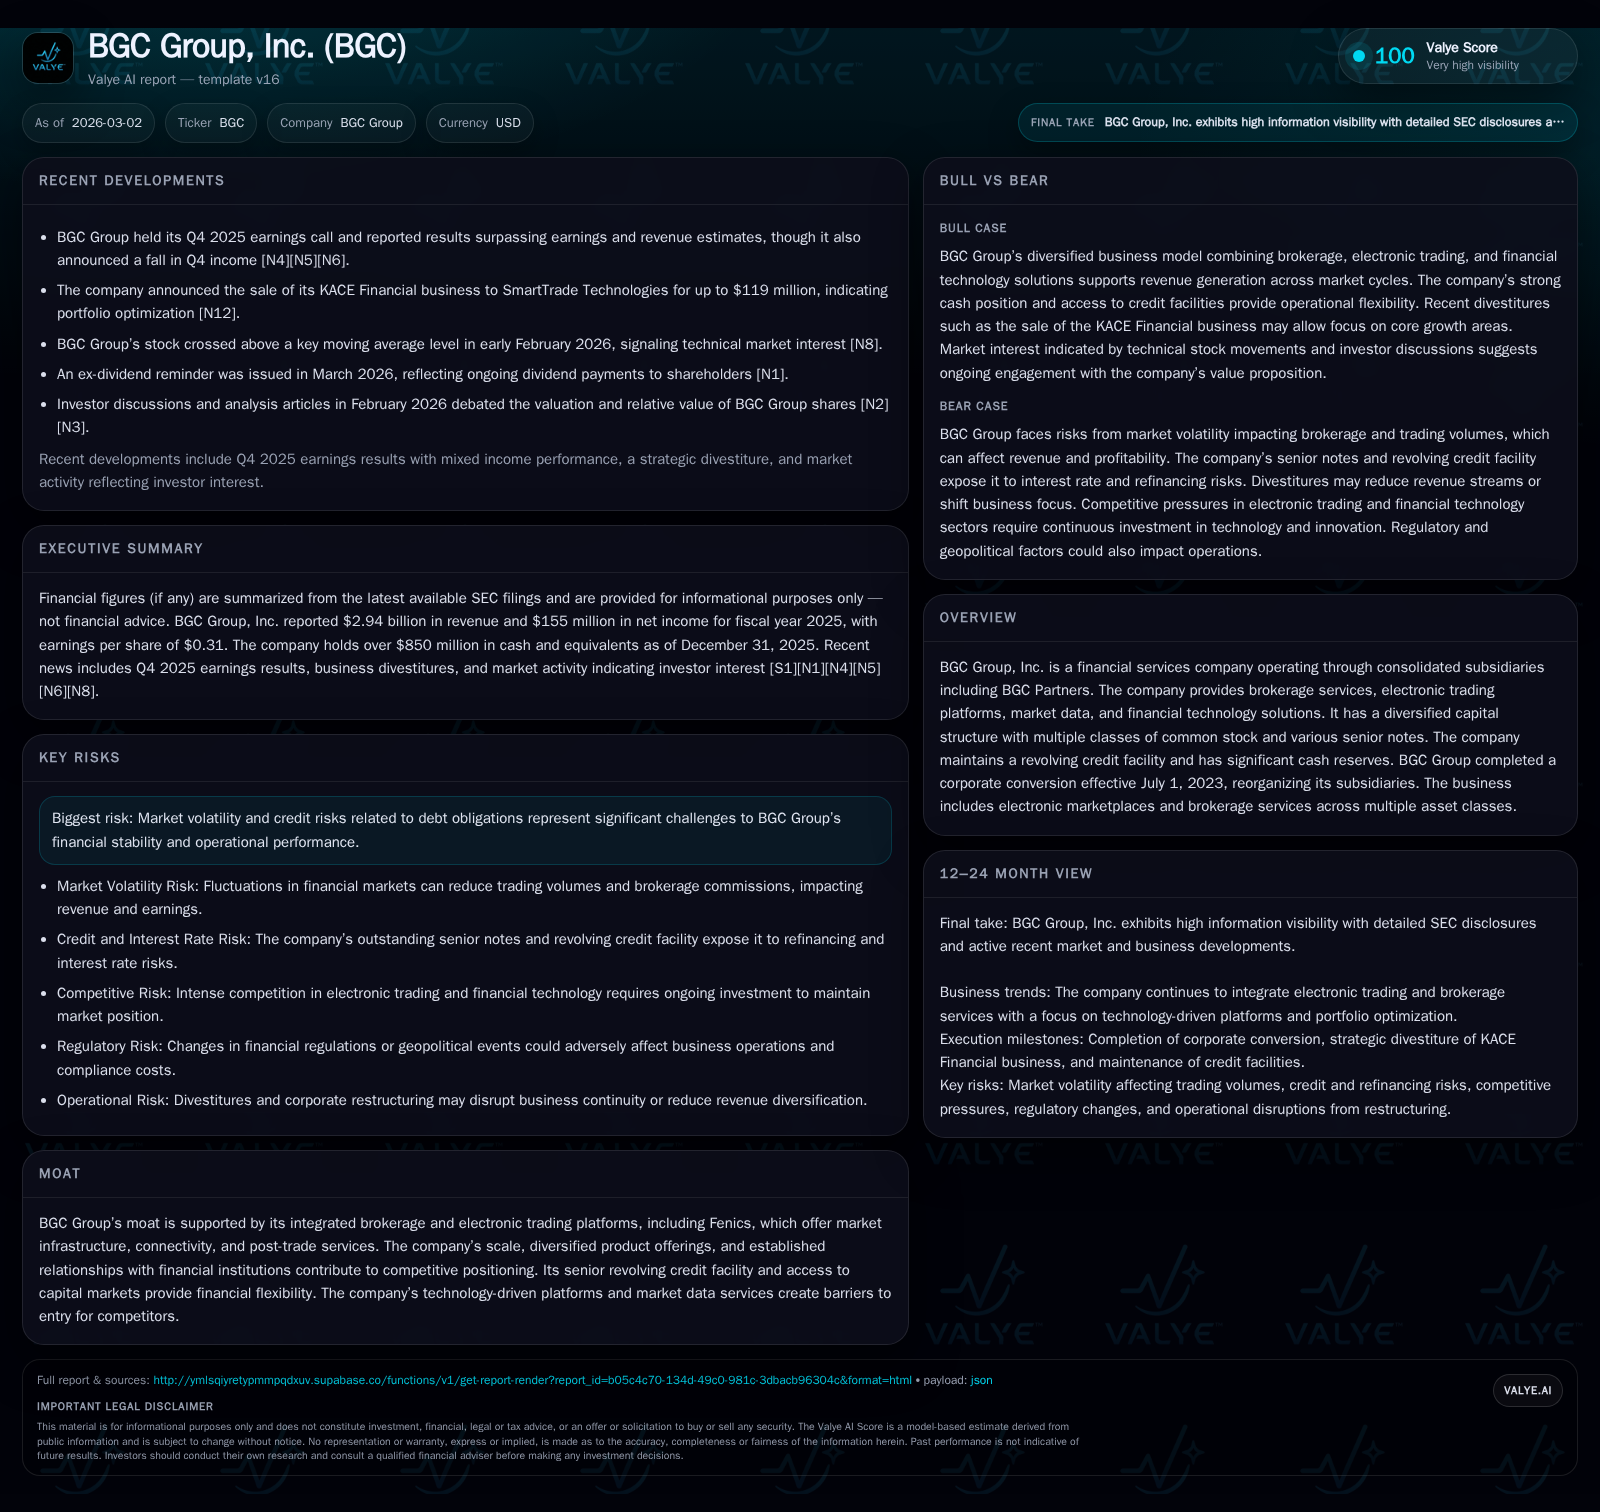
In 2025, BGC Group, Inc. achieved a significant financial milestone with revenue reaching $2.94 billion, reflecting a sharp 30% year-over-year increase that eclipsed prior growth rates. This surge was fueled by heightened trading volumes, broader adoption of its Fenics electronic trading platform, and the expansion of diversified brokerage services. Amid these operational strides, BGC has maintained robust liquidity supported by a well-structured capital base featuring multiple senior notes and a substantial revolving credit facility. Nonetheless, market volatility and credit risk remain material headwinds as the company navigates evolving market infrastructure demands.
Record Revenue Growth: Tracking BGC’s Financial Ascension
The fiscal year 2025 represented a hallmark period for BGC Group, Inc., where total revenues surged sharply to $2.94 billion — a formidable 30% rise over the prior year's $2.26 billion figure [F1]. This performance notably outpaced the more moderate increases seen between FY2022 and FY2024, where revenues expanded from $1.79 billion to $2.03 billion and then to $2.26 billion, respectively. Correspondingly, net income increased by nearly 26%, climbing from $123 million in FY2024 to approximately $155 million in FY2025 – reflecting operational leverage amidst growing brokerage activity.
Operating cash flow exhibited solid growth too (up 25% YoY to $394 million), which alongside disciplined capital expenditures capped at around $21 million (down nearly 28% YoY) facilitated free cash flow generation exceeding $370 million [F1]. This robust cash generation capacity underpins not only ongoing investment into technology but also supports capital returns initiatives detailed later.
Historical performance (annual)
| FY | Rev ($bn) | Net ($mm) | CFO ($mm) | Capex ($mm) | Rev YoY | Net YoY |
|---|---|---|---|---|---|---|
| 2025 | 2.9 | 155 | 394 | 21 | +30.0% | +25.8% |
| 2024 | 2.3 | 123 | 315 | 30 | +11.7% | +317702.7% |
| 2023 | 2.0 | 0 | 405 | 15 | +12.8% | -99.9% |
| 2022 | 1.8 | 49 | 224 | 11 |
Source: SEC companyfacts cache [F1].
Capital returns and efficiency (annual)
| FY | Div ($mm) | Buybacks ($mm) | FCF ($mm) |
|---|---|---|---|
| 2025 | 39 | 282 | 373 |
| 2024 | 34 | 262 | 286 |
| 2023 | 17 | 115 | 390 |
| 2022 | 15 | 104 | 214 |
Source: SEC companyfacts cache [F1].
All figures from SEC filings and validated company facts [F1]
Drivers Behind the 2025 Performance Jump
Management commentary during the Q4 FY2025 earnings call emphasized several catalysts explaining this step-change growth trajectory [N1][N2]. Chief among these was the elevated trading volumes triggered by dynamic market conditions combined with increased client footfall into BGC’s hybrid brokerage modes.
Fenics—a proprietary electronic trading platform—played an outsized role in capturing new business flows, expanding BGC's presence across fixed income products and derivatives [S1]. The platform's algorithmic pricing and seamless connectivity APIs delivered tangible value enhancements relative to traditional voice broking segments. Further momentum came from expanded market data offerings and ancillary post-trade solutions bolstering recurring revenue streams.
Together these factors formed an integrated ecosystem enabling clients to access liquidity pools efficiently while leveraging BGC’s scale advantages amid competitive pressures.
Technology Platforms and Brokerage Services as Market Differentiators
BGC’s moat fundamentally rests on the cohesion between its electronic marketplaces—including Fenics—and traditional brokerage services that provide critical market infrastructure and connectivity [S1]. This integration affords superior execution speed, reliable price discovery mechanisms, and post-trade processing capabilities uncommon among peers.
As a fixed income-focused intermediary, BGC leverages its technology stack to offer enhanced liquidity sourcing by aggregating multi-venue order books while maintaining voice-broker expertise for complex negotiation needs. Its API-driven platforms facilitate algorithmic strategies increasingly favored in institutional trading—a key barrier for entrants lacking both technological depth and regulatory footholds.
Fenics’ continuous innovation with real-time pricing engines underscores the technological pivot industrywide towards hybrid execution models balancing automation with human oversight.
Capital Structure Evolution and Liquidity Highlights
BGC’s capital framework is characterized by a diversified debt portfolio coupled with significant liquidity buffers enhancing operational flexibility [S4][S5][S6][S7]. The company currently maintains multiple senior note issuances:
- A $700 million tranche bearing a coupon of approximately 6.15%, maturing in April 2030,
- A recent issuance of $500 million at roughly a 6.60% coupon due June 2029,
- Additional outstanding notes at lower coupons maturing through late-2025 but largely refinanced following October 2023 exchange offers,
- Plus smaller amounts of higher coupon debt replenishing liquidity pools.
Complementing bonds is an unsecured senior revolving credit facility capped at $700 million with Bank of America acting as administrative agent; this facility bears interest pegged to SOFR or base rates with maturity slated for April 2027 [S4][S5]. At fiscal year end, cash and equivalents stood robustly at approximately $852 million — collectively enabling ample runway against near-term maturities.
This prudent balance sheet management underpins strategic optionality in deploying capital towards organic growth investments or opportunistic share repurchases without compromising coverage ratios or debt servicing capacity.
Dividend Policy, Share Buybacks, and Returns to Shareholders
Consistent with improving profitability metrics, BGC has progressively stepped up shareholder returns via dividends and buybacks over recent years [F1]. Dividends almost doubled since FY2022 rising from roughly $15 million to nearly $39 million paid in FY2025 while stock repurchases have more than doubled within that period ($103 million in FY2022 to close to $282 million last year).
Such distributions correspond with operating cash flows comfortably exceeding capex outlays, yielding free cash flow near $373 million—an indicator of solid internal funding capability supporting shareholder distributions sustainably.
Employing net income against equity generates an approximate return on equity (ROE) estimate around 16%, evidencing effective utilization of invested capital even amid rigorous compliance and credit costs likely inherent within financial services intermediaries [F1].
Emerging Constraints and Market Volatility Risks
Despite notable operational gains, disclosures flag prominent risks centering on market volatility’s ripple effects across trading revenues plus exposure related to debt servicing obligations under various credit instruments [N10][S1]. Fluctuating macroeconomic environments can depress broker commissions due to subdued deal flows or thin spreads wave through electronic markets diminishing margins.
Credit risk considerations are amplified given sizeable outstanding senior notes maturing through mid-decade combined with potential tightening funding conditions—necessitating active treasury management and strategic access to capital markets over the medium term.
These challenges are endemic within broker-dealer franchises but require vigilant balance sheet stewardship alongside continued innovation-driven client retention efforts.
Strategic Outlook: What Lies Ahead for BGC
Analysis of management guidance from recent quarters indicates cautious optimism oriented toward leveraging further technological adoption particularly evolving Fenics functionality while navigating regulatory nuances affecting post-trade workflows alongside competitive landscape shifts [N1][N2].
Anticipated growth vectors include incremental penetration into less automated asset classes complemented by deeper data analytics offerings fueling sticky revenue streams—with cost discipline remaining essential given cyclical commercial sensitivities.
Points to monitor involve pipeline updates on new platform feature rollouts or client wins as well as any amendments impacting funding cost structure given rising interest rate backdrops—all crucial gauges shaping trajectory beyond current fiscal cycles.
Key Milestones from Recent Earnings and Corporate Updates
Noteworthy corporate developments include BGC's July 1, 2023 corporate conversion restructuring legal entities for operational clarity aligning subsidiaries cohesively under BGC Group Inc., facilitating cleaner financial disclosures post transition [N11].
Further amendments across credit agreements during late-2024 enhance borrowing flexibility while recent quarterly results demonstrated consistent outperformance versus consensus earnings estimates nurturing positive investor sentiment corroborated by technical indicators showing key moving average breakouts supportive of momentum narratives ([N11]).
These milestones collectively signify reinforcing foundation positioning BGC for sustained relevance amid evolving brokerage technology paradigms.
This analysis synthesizes publicly available financial data, SEC filings, and recent earnings commentary without proposing investment recommendations or forecasts beyond stated disclosures. Readers should conduct further due diligence regarding market conditions impacting BGC Group and peers.
Disclaimer: This is research-only, informational analysis and not investment advice. It may include AI-generated interpretation and general industry context. Always verify important details using primary sources.

Comments