
Quest Diagnostics' 2025 Financial and Operational Profile Highlights Growth, Risks, and Capital Strategy
Quest Diagnostics delivered solid operating income growth in 2025 supported by diversified revenue streams and ongoing modernization, while navigating regulatory and legal challenges.
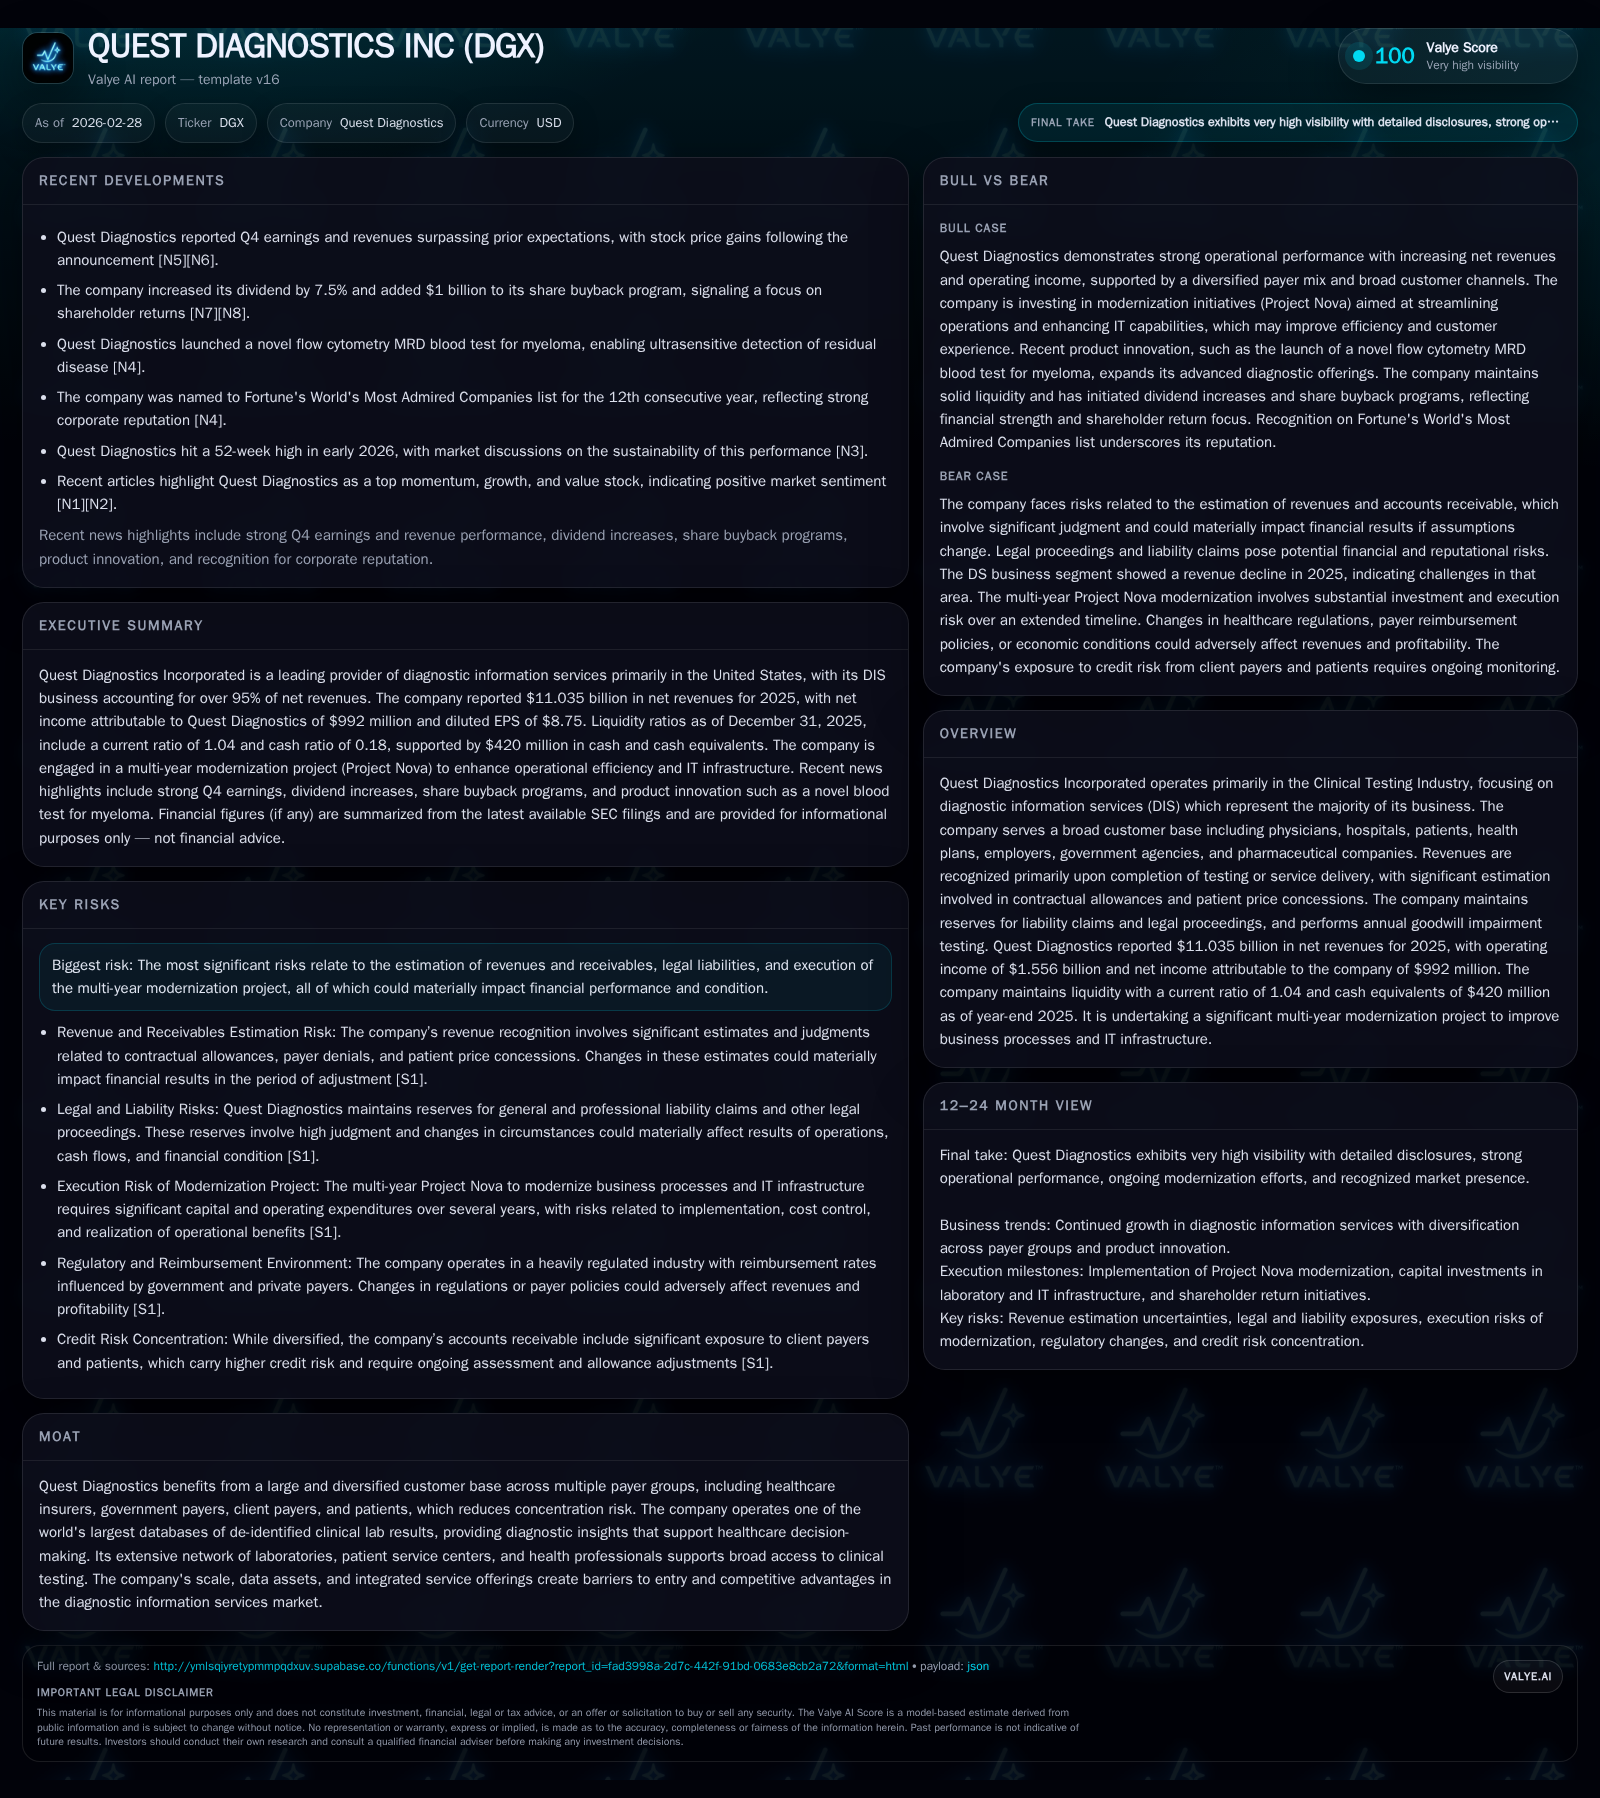
Quest Diagnostics Incorporated reported $11.035 billion in net revenues for 2025 with a 15.6% increase in operating income to $1.556 billion and a net income rise of nearly 14%. Its diagnostic information services (DIS) segment dominates the business, serving a broad healthcare ecosystem that mitigates concentration risk. The company pursues a multi-year modernization project expected to enhance operational efficiency through 2032. On capital allocation, Quest increased its dividend by 7.5% and authorized an additional $1 billion share repurchase program. Key risks stem from revenue recognition complexities, legal proceedings, and execution of Project Nova.
Historical Performance
Quest Diagnostics Incorporated maintained sizable revenues in the Clinical Testing Industry with reported net revenues totaling approximately $11.035 billion for fiscal year 2025 [F1]. This figure represents a modest year-over-year decline of about 5%, which can be attributed largely to payer reimbursement pressures common in the diagnostic services sector.
Despite the slight revenue contraction, the company achieved meaningful improvement in profitability metrics. Operating income advanced from $1.346 billion in 2024 to $1.556 billion in 2025, marking a robust growth rate of approximately 15.6% [F1]. Net income attributable to Quest rose nearly 14%, reaching $992 million for the full year, signaling successful cost management measures alongside revenue stabilization efforts.
Cash flow performance supported these earnings results; operating cash flow expanded sharply by over 40%, increasing from around $1.334 billion in fiscal year 2024 to about $1.886 billion in fiscal year 2025 [F1]. This step-up largely reflects improved working capital dynamics despite ongoing investments in business modernization.
Supportive CapEx outlays climbed materially as well—rising roughly 24% year-over-year from $425 million in FY24 to $527 million in FY25—to underpin ongoing upgrades particularly related to laboratory automation, information technology systems, and clinical infrastructure enhancements [F1]. These investments align with management's stated commitment to evolving the company's technical capabilities.
A high-level financial summary is provided below:
Historical performance (annual)
| FY | Net ($mm) | CFO ($mm) | OpInc ($mm) | Capex ($mm) | Net YoY |
|---|---|---|---|---|---|
| 2025 | 992 | 1886 | 1556 | 527 | +13.9% |
| 2024 | 871 | 1334 | 1346 | 425 | +2.0% |
| 2023 | 854 | 1272 | 1262 | 408 | -9.7% |
| 2022 | 946 | 1718 | 1428 | 404 |
Source: SEC companyfacts cache [F1].
Capital returns and efficiency (annual)
| FY | Div ($mm) | Buybacks ($mm) | FCF ($mm) |
|---|---|---|---|
| 2025 | 353 | 450 | 1359 |
| 2024 | 331 | 151 | 909 |
| 2023 | 314 | 275 | 864 |
| 2022 | 305 | 1408 | 1314 |
Source: SEC companyfacts cache [F1].
The above table summarizes key financial metrics extracted from reported data for FY25; prior year data is partial due to limited explicit figures.
Business Model & Moat
Quest Diagnostics' core operations revolve around Diagnostic Information Services (DIS), which accounted for more than 95% of its revenue, affirming the company's focused expertise within clinical testing [S15]. The DIS segment serves diverse customer channels such as physicians, hospitals, patients, health plans, employers, government agencies, and pharmaceutical companies [S15]. This broad payer-base diversification reduces single-point exposure risks while providing stable demand across healthcare subsystems.
The company’s competitive positioning benefits substantially from its expansive laboratory network coupled with one of the world's largest repositories of de-identified clinical lab results—an asset enabling advanced diagnostic insights that feed into improved healthcare decision-making continuity .
Furthermore, Quest pursues integrated service offerings that bundle diagnostic testing with data-driven healthcare analytics solutions which create structural barriers against new entrants given the significant investment requirements and regulatory hurdles associated with this sector.
Future Growth Prospects
Looking ahead, Quest Diagnostics’ growth catalysts predominantly hinge on:
- Successful execution of "Project Nova," a multi-year initiative initiated in February 2025 targeting modernization of "Order to Cash" processes anchored by advanced IT infrastructure upgrades and collaboration with Epic Systems [S7][S28]. Projected total expenditures range between approximately $250 million and $310 million through late-stage completion anticipated circa calendar years 2031–2032.
- Incremental operational efficiencies derived from this modernization that may unlock accelerated revenue capture potential alongside margin expansion over time.
- Continued scaling of data utilization capabilities unlocking monetization avenues across payers and providers seeking predictive diagnostics.
Conversely, growth could be constrained by reimbursement environment volatility—given roughly half the company’s costs are employee-related—and uncertainty stemming from escalating legal exposures connected with billing practices and privacy regulations [S4][S9][S24]. Furthermore, changes in healthcare legislation or payer mix dynamics may cap topline expansion.
Forecasts & Milestones
While explicit forward guidance on financial milestones was not detailed in public filings or recent earnings releases as of early 2026 [N3][N12], key observable indicators include:
- Management's February 2026 communication indicated confidence beating estimates for FY26 revenues and profits alongside a dividend raise and share repurchase increase reinforcing expected durability on cash generation capacity [N10][N12][N13].
- Project Nova milestones targeting incremental rollouts through early next decade set expectations for tangible operational uplift phases.
Analysts monitoring Quest should track progress on Project Nova deployment timelines closely given its long duration impact potential plus updates on litigations or regulatory findings that could inject episodic volatility.
Returns & Capital Allocation
Quest Diagnostics demonstrated disciplined capital stewardship evidenced by:
- A steady quarterly dividend stream augmented by a Board-authorized increase of +7.5% starting April payout bringing dividends to an annualized rate near $3.44 per share as per announcements made February ’26 [S17][N13].
- Active share repurchase programs culminating in substantial access replenishment: The Board authorized an additional $1 billion buyback tranche post-December close on top of existing frameworks; actual shares repurchased during FY25 amounted to almost $452 million having bought back approximately 2.5 million shares [S12][S17][N13].
- Return on equity approximating ~13.8% reflects well-executed profit generation relative to equity employed underpinning shareholder value creation prospects [F1].
- Free cash flow remains robust at about $1.36 billion after capital spending indicating healthy liquidity alongside ample headroom under credit facilities which remain undrawn at fiscal year-end [F1][S16][S19].
These factors combined demonstrate Quest’s balancing act between reinvestment into core business via capex (automation & IT) and shareholder returns through dividends and buybacks.
Risks & Legal Considerations
Significant risk vectors surround Quest Diagnostics due principally to:
- Revenue recognition complexity requiring estimations involving contractual allowances including payer denials/patient price concessions impacting receivable collectability assumptions—a critical accounting judgment area given transaction volume scales [S1][S25].
- Multiple active legal proceedings including class actions linked mostly to allegedly improper billing methodologies or privacy breaches notably relating to AMCA Data Security Incident fallout; while reserves modestly grew from $4 million in prior periods up to about $20 million as coverage against such contingencies [S24][S18][S9]. Management remains uncertain about ultimate outcomes but believes losses are not presently probable material events affecting solvency.
- Execution risk around Project Nova must be monitored carefully as technology transformation programs inherently carry timeline slippages or cost overruns potential affecting near-term results.
- Regulatory scrutiny within federal/state Medicaid billing practices plus investigations underway necessitate transparent cooperation; adverse rulings could alter operating models substantially.
Concluding Observations
Quest Diagnostics exhibits hallmark characteristics of an established healthcare diagnostics leader leveraging scale advantages coupled with extensive data assets tied integrally into evolving clinical practice patterns. Its recent financial results underscore resilience amidst headwinds characterized by reimbursement challenges yet offset partially by improved operational performance. Projected investments via Project Nova aim at delivering durable process enhancements while simultaneously the company maintains active capital return policies solidifying investor-aligned discipline. However, stakeholders should weigh intrinsic risks embedded within legal exposures and revenue estimation complexities alongside macro healthcare policy dynamics shifting underlying economics within this critical yet challenging sector.
This analysis is intended solely for informational purposes based on available public documents as of February 2026 without offering investment recommendations or forecasts beyond factual reporting.
Disclaimer: This is research-only, informational analysis and not investment advice. It may include AI-generated interpretation and general industry context. Always verify important details using primary sources.
Comments