
Frontdoor, Inc.: Driving Home Warranty Leadership with Sustainable Growth and Capital Discipline
Frontdoor combines its extensive contractor network and technology-driven platform with a recurring revenue model to fuel growth while managing significant indebtedness amid evolving market dynamics.
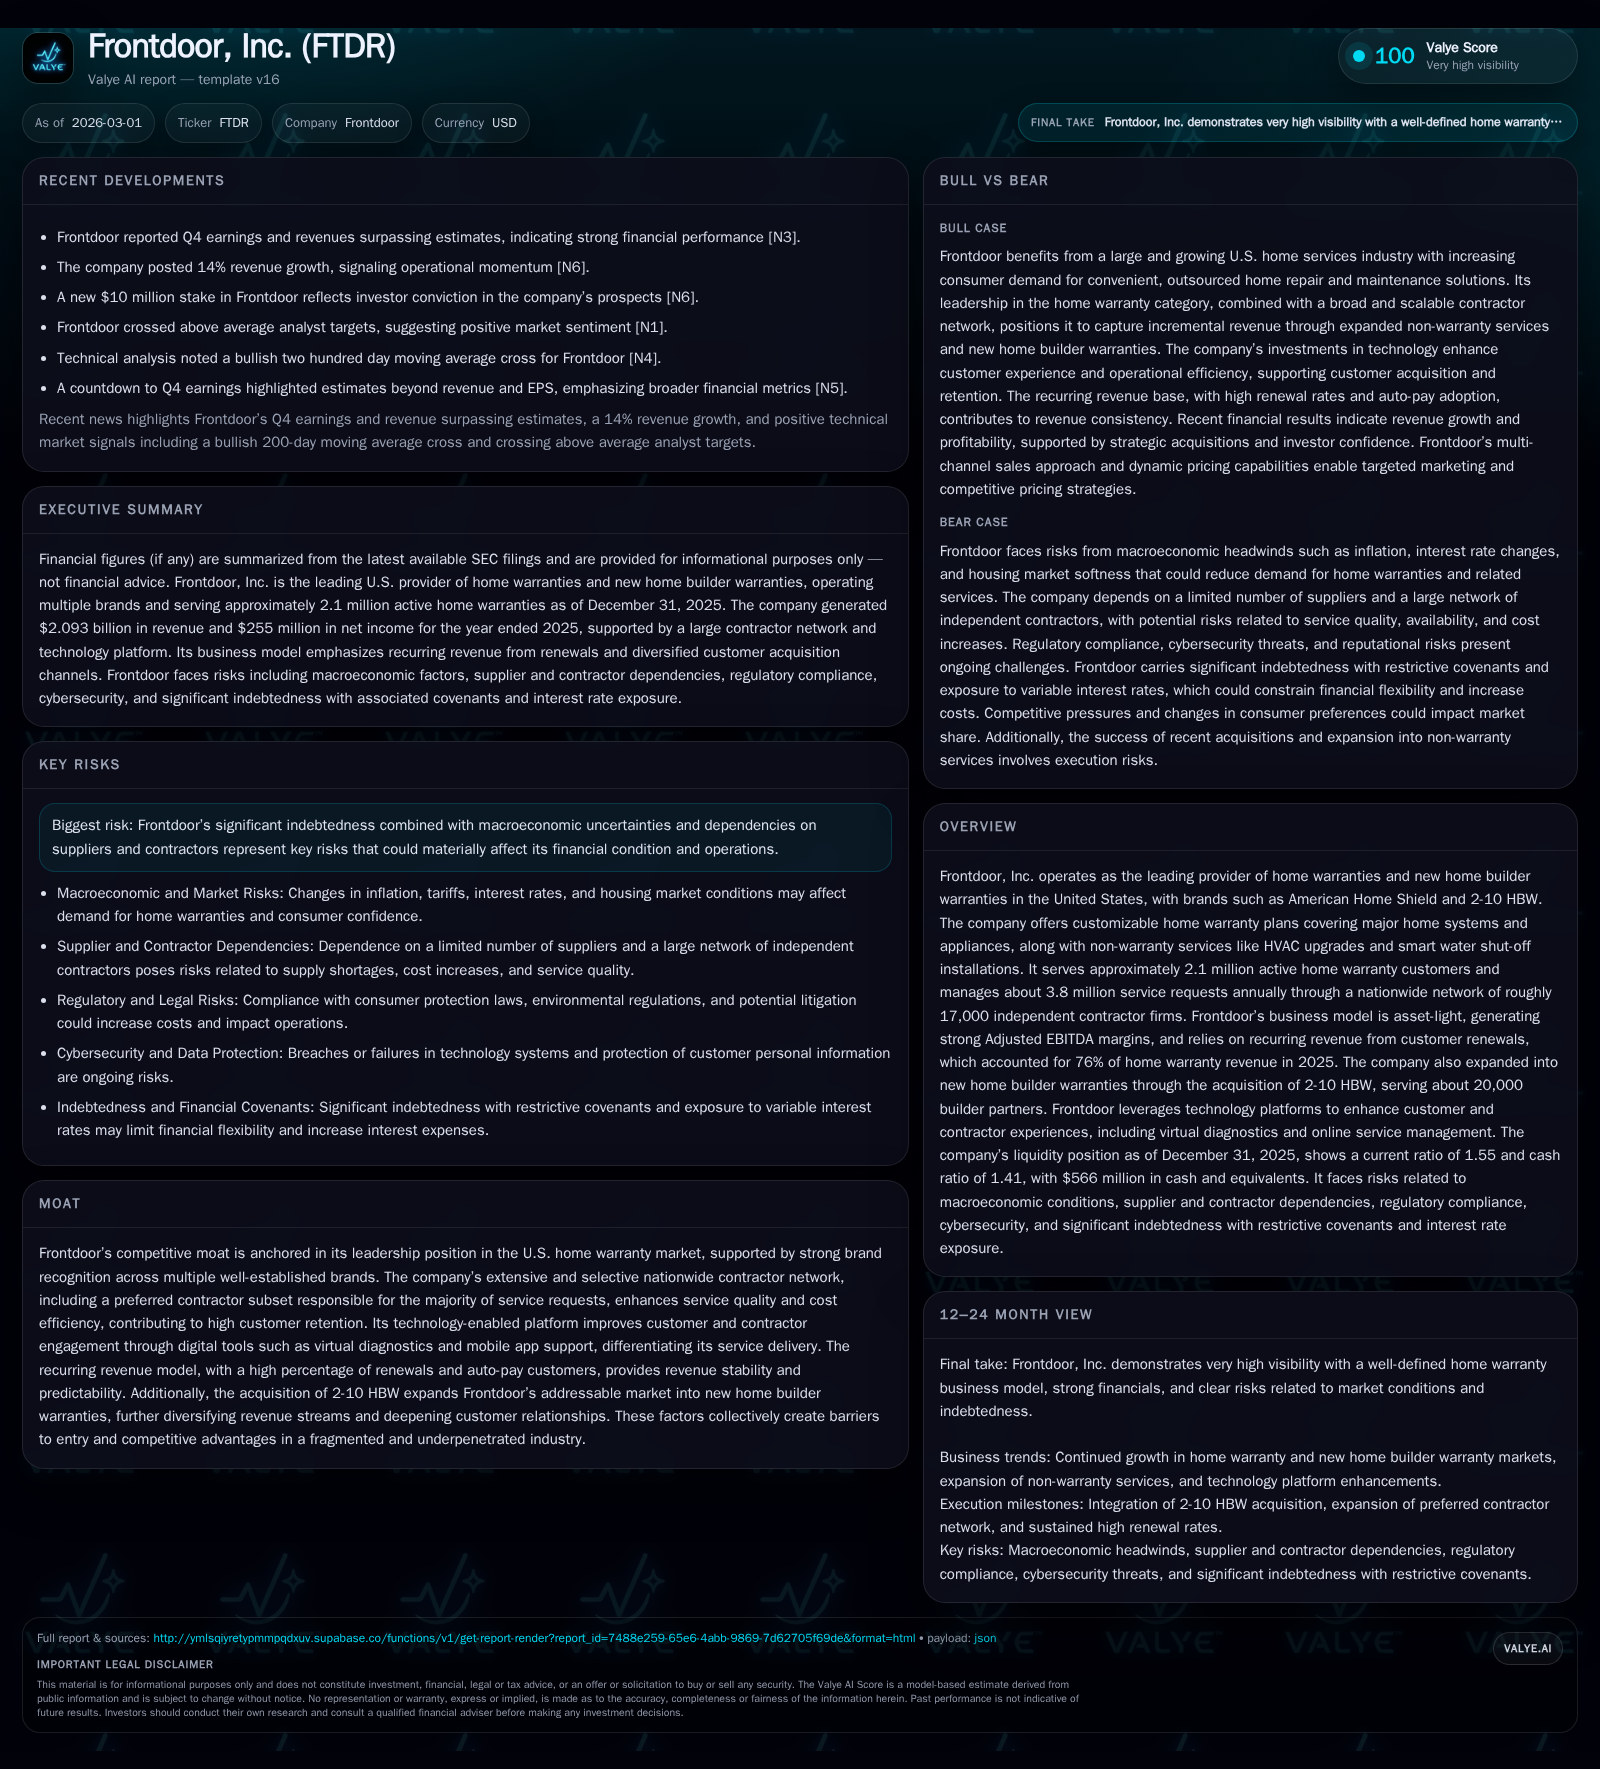
Frontdoor, Inc. leads the U.S. home warranty market leveraging a capital-light, recurring revenue business model supported by about 2.1 million active customers and a robust contractor network of approximately 17,000 firms. Its acquisition of 2-10 HBW expanded exposure to growing new home builder warranties, contributing to a 13.6% revenue CAGR from 2024 to 2025 and steady net income growth. The company's technology platform enhances customer engagement and operational efficiency, reinforcing high renewal rates that stabilize revenues. While generating strong free cash flow and returns, Frontdoor faces elevated leverage risks, including interest rate exposure and credit covenant constraints, which may restrict strategic flexibility going forward.
Robust Historical Growth Fueled by Recurring Revenues and Strategic Expansion
Frontdoor’s financial history from fiscal year (FY) 2022 through FY2025 highlights a consistent growth trajectory propelled mainly by its dominant position in the U.S. home warranty sector and strategic expansion through acquisitions. Revenue advanced from $1.66 billion in FY2022 to $2.09 billion in FY2025, reflecting a compound annual growth rate (CAGR) exceeding 10% overall and a sharper 13.6% increase between FY2024 ($1.84 billion) and FY2025 ($2.09 billion) [F1].
This acceleration was supported substantially by recurring revenue streams: the renewal channel accounted for approximately three quarters (76%) of total home warranty revenue in FY2025 [S14]. Renewal rates remained resilient across all major customer acquisition channels — notably including a direct-to-consumer (DTC) channel renewal rate above 74%. The acquisition of new home builder warranty provider 2-10 HBW in late 2024 contributed meaningful incremental revenue and expanded Frontdoor’s reach into roughly 20,000 builder partners nationally [S16][S24].
Net income similarly showed strong upward momentum rising from $71 million in FY2022 to $255 million in FY2025 (+8.5% YoY between FY2024–25), showcasing effective margin control amid scaling operations [F1]. This profit growth underscores Frontdoor's capability to enhance profitability alongside top-line expansion.
Historical performance (annual)
| FY | Rev ($bn) | Net ($mm) | CFO ($mm) | Capex ($mm) | Rev YoY | Net YoY |
|---|---|---|---|---|---|---|
| 2025 | 2.1 | 255 | 416 | 26 | +13.6% | +8.5% |
| 2024 | 1.8 | 235 | 270 | 39 | +3.5% | +37.4% |
| 2023 | 1.8 | 171 | 202 | 32 | +7.1% | +140.8% |
| 2022 | 1.7 | 71 | 142 | 40 |
Source: SEC companyfacts cache [F1].
Capital returns and efficiency (annual)
| FY | Buybacks ($mm) | FCF ($mm) | ROE% |
|---|---|---|---|
| 2025 | 283 | 390 | 105.4 |
| 2024 | 161 | 231 | 98.3 |
| 2023 | 121 | 170 | 125.7 |
| 2022 | 59 | 102 | 116.4 |
Source: SEC companyfacts cache [F1].
Numbers sourced exclusively from Form 10-K fiscal years ending December each year [F1].
Differentiated Service Model: Contractor Network and Technology Platform as Competitive Weapons
Central to Frontdoor’s moat is its efficient service delivery leveraging a nationwide independent contractor network encompassing approximately 17,000 professional firms across diverse trades [S23]. A curated subset — approximately 4,200 preferred contractors — fulfilled an estimated eighty-four percent of all home warranty service requests in calendar year 2025 [S24]. These preferred contractors are selected based on rigorous criteria encompassing licensing status, insurance coverage adequacy, online reputation metrics, direct customer feedback, workmanship quality standards, promptness of service delivery, and adherence to contractual obligations.
This network not only supports superior service reliability but also enhances operating economics through reduced claims costs and improved retention rates as higher contractor quality correlates with increased customer satisfaction [S8][S24]. Further differentiating Frontdoor is its investment in a technology-enabled platform that facilitates digital self-service capabilities for customers — around sixty percent of service requests are initiated online or via interactive voice response systems — streamlining access while enabling virtual diagnostics using smartphone cameras during video chats [S13][S14].
The company leverages dynamic pricing models powered by proprietary data analytics that adjust plan pricing based on regional market characteristics and contractor strength — a practice reflecting sector trends toward price optimization beyond traditional state-level flat pricing [S6]. These capabilities enable Frontdoor not only to maintain competitive pricing but also extend service reach toward previously underserved homeowner segments.
Emerging Challenges: Managing Elevated Leverage Amid Market Fluctuations
While Frontdoor’s business model delivers operational efficiencies and predictable revenue streams through renewals, the company carries significant long-term debt obligations amounting to approximately $1.17 billion as of December 31, 2025 [S11][F1]. This indebtedness is primarily allocated under Term Loan Facilities bearing variable interest rates benchmarked against SOFR with partial mitigation via interest rate swaps; nevertheless, the firm remains exposed to interest rate fluctuations that may increase borrowing costs by roughly $6 million annually per percentage point rise in rates post-swap adjustments [S7][S10].
Credit ratings currently reside at non-investment grade levels, heightening refinancing risks or cost escalations if ratings deteriorate further under adverse conditions [S7]. Additionally, covenants within credit agreements restrict Frontdoor’s ability to incur additional indebtedness freely or undertake substantial acquisitions without lender approval; these limitations can constrain maneuverability for strategic investments or operational adjustments should market conditions worsen [S4][S5].
Macroeconomic factors such as inflationary pressures on parts and appliances costs present further risks affecting margins alongside possible reductions in consumer discretionary spending impacting demand for warranty services [S18][S19]. The company also depends on third-party contractors who operate independently; any inability to recruit or retain quality contractors could disrupt service provision leading to customer dissatisfaction and reputational impacts [S27].
Targeting Future Growth Through Market Penetration and Product Diversification
Management aims to drive future expansion primarily through deepening penetration within existing channels—particularly the DTC segment where margins are higher due to limited intermediaries—and broadening builder warranty relationships facilitated by multi-year agreements targeting preferred builders [S16][N4][S24]. This mix aligns with industry direction favoring diversified product suites beyond traditional warranty coverage into ancillary non-warranty services such as HVAC system upgrades and smart water shut-off partnerships enhancing customer value proposition.
Sophisticated consumer analytics underpin multichannel marketing strategies involving real estate partners, national sales teams, content marketing, online reputation management platforms, social media campaigns, telemarketing within regulatory limits, and dynamic price modeling tailored by regional factors [S6][N4]. These enable more targeted segmentation promising higher conversion rates particularly among customers seeking convenience combined with protection.
Evolving technological investments focused on platform enhancements aim to improve both customer experience—through virtual expert interactions—and contractor engagement via streamlined scheduling tools further embedding Frontdoor as an integrated ecosystem player within residential service markets [S16][S24]. Continued innovation here serves both retention uplift as well as incremental cross-selling opportunities.
Capital Allocation Strategy: Buybacks Lead While Dividends Remain Dormant
Capital discipline remains evident with substantial free cash flow generation complemented by prudent spending: operating cash flows surged over fifty-four percent year-over-year while capital expenditures fell by one-third in FY2025 relative to prior years illustrating effective working capital management alongside controlled reinvestments into technology platforms rather than heavy fixed asset outlays characteristic of capital-intensive sectors [F1].
This disciplined cash generation fuels ongoing aggressive share repurchases totaling approximately $283 million in FY2025 compared with $161 million the prior year—a clear signal prioritizing stock buybacks as primary capital return mechanism given absence of dividend payments since at least FY2018 reflects a yield-undistributed equity appreciation approach favored amid reinvestment needs [F1]. The company retains ample liquidity headroom with about $566 million cash balance at year-end supporting operational flexibility despite debt servicing requirements [F1][S9].
Financial Health Snapshot: Cash Flow Strength Overshadowed by Debt Service Burden
The following table summarizes key financial metrics evidencing front-end operational strength juxtaposed against notable financial leverage:
| Fiscal Year | Revenue (USD Millions) | % YoY Growth | Net Income (USD Millions) | % YoY Growth | Operating Cash Flow (USD Millions) | % YoY Growth | Capital Expenditures (USD Millions) |
|---|---|---|---|---|---|---|---|
| FY2022 | 1662 | 71 | 142 | 40 | |||
| FY2023 | 1780 | +7.1% | 171 | +140.8% | 202 | +42.3% | 32 |
| FY2024 | 1843 | +3.6% | 235 | +37.4% | 270 | +33.7% | 39 |
| FY2025 | 2093 | +13.6% | 255 | +8.5% | 416 | +54.1% | 26 |
Return on equity approximates over one hundred percent based on net income relative to equity growth from $61 million in FY22 to $242 million at end-FY25 indicating a highly leveraged capital structure amplifying earnings but implying elevated financial risk from limited shareholder equity base versus earnings generated [F1].
What Investors Should Watch: Renewal Rates, Cost Pressures, and Acquisition Execution
Looking ahead requires focus on several key operational benchmarks:
- Continued resilience or gains in homeowner renewal rates across main distribution channels — especially direct-to-consumer where lifetime value exceeds other routes — remains critical for predictable organic revenue streams given their dominant share in total sales mix [N1][N2][S14].
- Inflation-driven cost pressures spanning parts procurement through supplier networks could compress margins unless offset by dynamic pricing models or enhanced contractor efficiencies; monitoring parts spend relative weight (~22%) is essential given concentration among six key national suppliers each exceeding five percent spend individually [S13][S18]
- Timely integration success of the recently acquired new home builder warranty business is necessary to realize expected synergies: transitioning builder partners into multi-year contracts positively affects repeat revenue stability but execution lags or unforeseen risks could temper expansion benefits [N4][S24]
- Maintenance of contractor network quality metrics is vital amidst competitive labor markets potentially challenging onboarding or replacing high-standard firms; declines here could impair customer satisfaction leading to churn or reputational issues given high reliance on independent subcontractors overseen but not controlled directly by Frontdoor [S27]
- Impact of interest rate variability on finance expense requiring ongoing hedging efficacy assessments will influence net profitability given variable-rate debt exposure partially mitigated by swaps which expired mid-2025 necessitating careful monitoring post-expiration effects beyond disclosed figures [S7][S10]
Continued innovation leveraging technology-enabled platforms for virtual diagnostics and digital self-service channels could serve as levers for both cost containment and enhanced customer experience amidst increasingly competitive industry dynamics.
Disclaimer: This analysis is based solely on publicly available information including regulatory filings and credible news sources up to March 1, 2026; it does not constitute investment advice or recommendations regarding securities transactions.
Disclaimer: This is research-only, informational analysis and not investment advice. It may include AI-generated interpretation and general industry context. Always verify important details using primary sources.

Comments