
Montrose Environmental's Recovery Trajectory and Financial Rebound After Prolonged Losses
Montrose Environmental Group shows a marked shift from multi-year net losses to positive operating cash flow in 2025, driven by strategic segment growth and disciplined capital management.
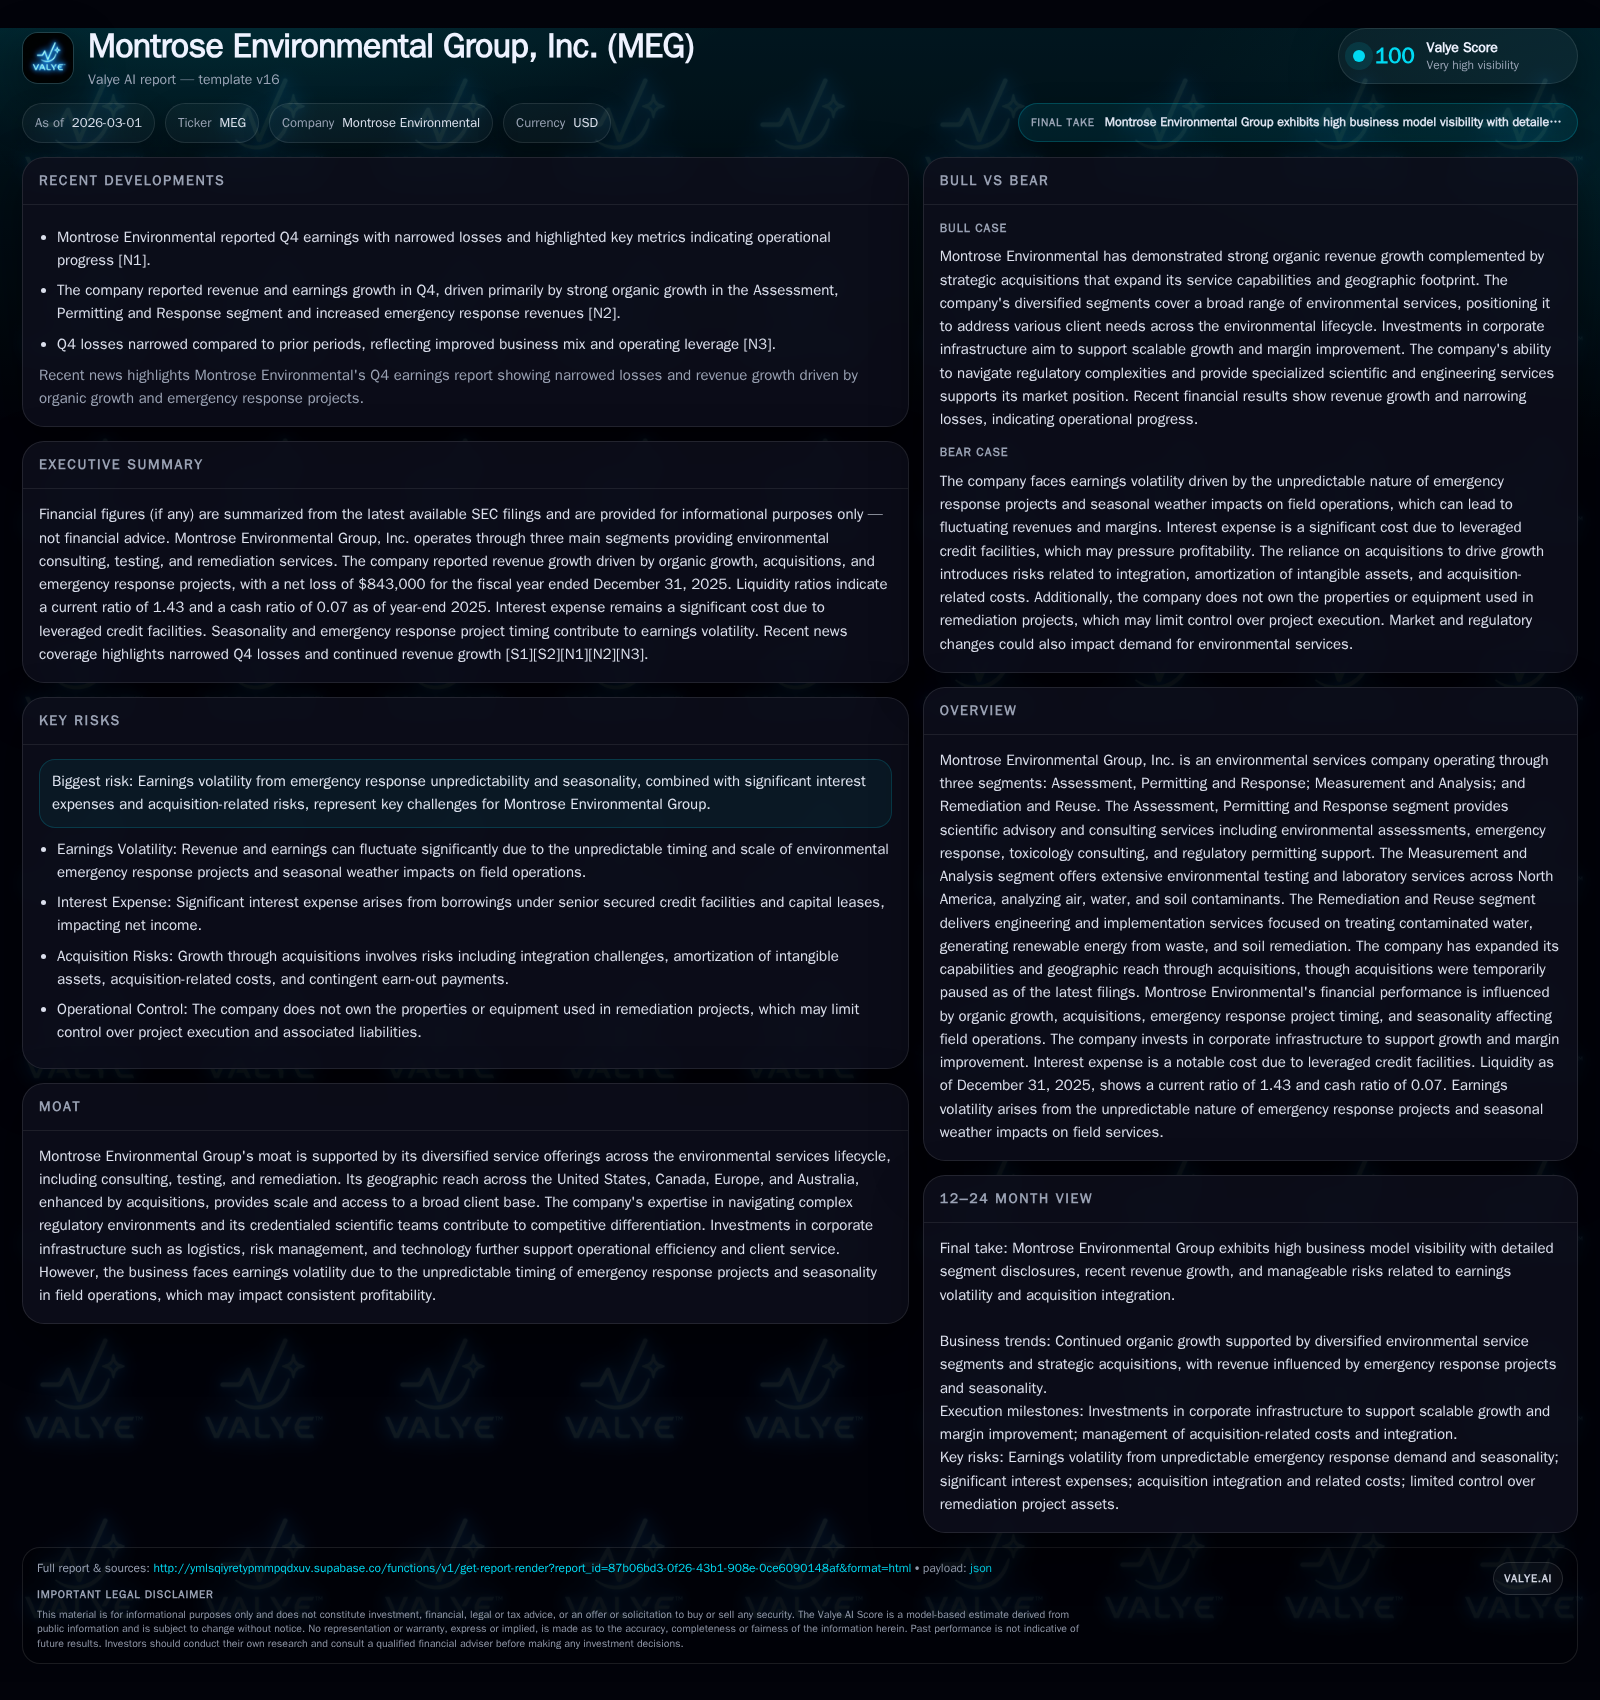
Montrose Environmental Group, Inc. endured successive annual net losses through 2022-2024 but reversed its operational trajectory in 2025 with a substantial 131.9% year-over-year operating income improvement, reaching positive territory. This turnaround was underpinned by robust performance across its three core segments—Assessment, Permitting and Response; Measurement and Analysis; and Remediation and Reuse—and a significant cash flow generation leap. While the company continues to grapple with earnings volatility tied to unpredictable emergency response projects and seasonal field operations, its refined capital allocation strategy, including a temporary pause on acquisitions and infrastructure investments, supports improved financial resilience. Key risks remain around interest expenses linked to elevated leverage, yet free cash flow strength and margin expansion efforts are promising.
Evolution of Performance: From Operating Losses to Improving Margins
Montrose Environmental Group has exhibited a notable financial transformation after several years of operating setbacks. Its operating income reversed course dramatically in fiscal 2025, delivering $11.7 million in positive operating income compared with a steep $36.7 million loss in fiscal 2024—a year-over-year improvement of approximately 132% as documented by company facts [F1]. This shift signals enhanced operational control and revenue scalability across its service offerings.
Net income reflected similar improvement trends but remained slightly negative at -$0.8 million for the full year 2025 versus a substantially larger loss of -$62.3 million in 2024 [F1]. This narrowing net loss indicates progress toward consistent profitability though challenges persist.
Operating cash flow (CFO) accelerated significantly as well—from $22.2 million in 2024 to an impressive $107.5 million in 2025—outstripping the company’s capital expenditures which declined from $21.3 million to $16.3 million over the same period [F1]. This robust cash flow conversion has bolstered Montrose’s liquidity position and enabled free cash flow generation near $91 million, underscoring improved capital efficiency.
Historical performance (annual)
| FY | Net ($mm) | CFO ($mm) | OpInc ($mm) | Capex ($mm) | Net YoY |
|---|---|---|---|---|---|
| 2025 | -1 | 107 | 12 | 16 | +98.6% |
| 2024 | -62 | 22 | -37 | 21 | -101.9% |
| 2023 | -31 | 56 | -28 | 30 | +3.0% |
| 2022 | -32 | 21 | -28 | 10 |
Source: SEC companyfacts cache [F1].
Capital returns and efficiency (annual)
| FY | Div ($mm) | FCF ($mm) | ROE% |
|---|---|---|---|
| 2025 | 4 | 91 | -0.2 |
| 2024 | 11 | 1 | -14.0 |
| 2023 | 16 | 26 | -9.6 |
| 2022 | 16 | 11 | -10.2 |
Source: SEC companyfacts cache [F1].
Data sourced from company filings for FY ending December each year [F1].
Segment Analysis: Driving Revenue and Profitability Across Services
Montrose operates three principal segments aligned with the full environmental services lifecycle: Assessment, Permitting and Response; Measurement and Analysis; and Remediation and Reuse [S2][S8][S13].
The Assessment segment delivers scientific advisory including toxicology consulting and regulatory permitting support that guide clients through complex compliance landscapes at multiple government levels—leveraging credentialed specialists adept at navigating evolving environmental regulations [S2]. Emergency response services within this segment are high-margin but episodic by nature.
Measurement and Analysis is a cornerstone business offering extensive multi-media laboratory services focused on air quality monitoring, soil testing and water contaminant profiling throughout North America [S7][S8]. Advanced analytic techniques underpin client assurances on public health impacts.
Remediation and Reuse undertakes engineering design and implementation projects aimed at contaminated water treatment or soil rehabilitation; some projects incorporate renewable energy creation from waste streams—positioning Montrose within a sustainability-driven niche [S2][S12]. These solutions mitigate environmental liabilities without direct ownership of underlying assets or facilities.
Collectively these segments form differentiated service lines with orthogonal margin profiles balanced between consulting advisory fees plus technical lab throughput contracts and engineering project delivery fees.
Navigating Earnings Volatility: Emergency Response and Seasonality Impacts
A defining characteristic shaping Montrose’s earnings pattern is the unpredictability inherent to emergency response revenue streams highlighted within the Assessment segment [S10][N5]. Environmental incidents vary greatly in timing and size making forecasting difficult.
Seasonality further compounds variability; field operations typically face winter constraints restricting access for soil sampling or remediation work while laboratory testing demand fluctuates inversely but does not fully offset lower field activity during colder months [S5][S9].
This yields quarterly swings notable particularly between Q1/Q4 troughs versus peak mid-year results mainly in Measurement & Analysis and Remediation where weather-dependent activity predominates [S20][S28]. The company notes it is better evaluated on an annual basis due to these intra-year swings.
Financial Position and Capital Allocation Strategy
Capital deployment reflects a cautious but growth-oriented stance wherein Montrose has paused acquisitions temporarily as it consolidates gains from prior deal-making cycles [S6][S9][S26]. Acquisitions historically extended geographic footprint into U.S., Canada and Australia along with broadening technological capabilities—a key strategic pillar now on hold pending stronger earnings consistency [S7][S14].
Meanwhile investments persist in enabling infrastructure such as logistics networks catering to broad footprint scalability plus R&D tailored toward innovative testing methodologies that underpin margin enhancement efforts across segments [S5][S9][S16]. These support expanding operational leverage as volumes rise organically.
Free cash flow generation exceeding $90 million forms the backbone of Montrose’s funding capacity for both reinvestment and servicing financial obligations achieved via capex discipline paired with efficient working capital management benefiting from accrued receivables controls despite occasional bad debt pressures linked to certain municipal clients [F1][S24].
Debt Profile, Interest Burden, and Capital Structure Trends
Montrose’s financial structure features a leveraged profile centered on its revolving credit facility refinanced into the '2025 Credit Facility' early that year delivering extended maturities but increasing total borrowings by roughly $10+ million to fund preferred stock redemptions among other needs [S5][S9].
Gross debt reached approximately $273 million mid-2025 with net interest expense rising accordingly; during the nine months ended September interest costs neared $14.9 million reflecting higher average debt levels compared with prior periods; management anticipates continued material interest expense due partially to this leverage strategy supporting past acquisitions plus working capital lines of credit usage [S5][S9].
While elevated interest burdens depress net income figures somewhat despite improved underlying operations revenue growth remains crucial for deleveraging options going forward.
Forward Views: Growth Prospects and Addressing Constraints
Montrose emphasizes organic growth as its primary growth engine moving forward following acquisition pauses; strong technical credentials enable differentiated positioning amid increasing regulatory complexity presenting sustained demand for consulting expertise alongside laboratory services validating contaminant exposure assessments critical for compliance frameworks [N1][N2][S2].
The Environmental Business International market study situates the U.S.-focused addressable market near $540 billion supporting ample headroom for expansion albeit competitive landscapes persist tightly contested among specialized niche providers disrupting margin trajectories through cost pressures explicitly noted as constraints along with unpredictable emergency revenue variability common industry-wide factors limiting quarterly predictability despite favorable long term fundamentals.
Shareholder Returns: Dividends, Buybacks, and ROE Context
Dividend payments contracted significantly reflecting constrained profits as Montrose favored balancing reinvestment needs against shareholder payouts; distributions dropped from roughly $11 million paid out in fiscal ’24 down to around $4.15 million for fiscal ’25 consistent with near-breakeven adjusted net incomes reported recently [F1].
Return on equity remains negative albeit marginally improved at approximately -0.2%, encapsulating the lagging impact of prior losses on equity value amid ongoing margin rehabilitation efforts underscoring persistence required toward sustainable profitability improvement notwithstanding encouraging steps evident through strong CFO conversion ratios detailed above [F1].
Key Milestones to Monitor: Catalysts for Sustained Profitability
Investors should track convergence toward consistent quarterly foundational revenue growth devoid of episodic spikes connected with large emergency projects pursuant to recent Q4 results where Montrose surpassed market expectations indicating possible inflection points toward steadier performance profiles [N1][N2].
Resumption of acquisitive activity will signal confidence in organic momentum translating into capacity for external expansion plus any successful scaling of emerging remediation technologies or testing platform upgrades supporting incremental margin lift initiatives will be critical milestones watched closely.
Additionally monitoring liquidity metrics including current ratio stability around ~1.43 alongside amortization patterns related to goodwill derived from past deals may offer insight into balance sheet resilience accompanying operational improvements documented herein [F1].
This analysis synthesizes publicly available financial data and regulatory disclosures without recommending investment actions or price targets; readers should consult multiple sources before forming opinions on company prospects.
Disclaimer: This is research-only, informational analysis and not investment advice. It may include AI-generated interpretation and general industry context. Always verify important details using primary sources.
Comments