
Markel Group Inc. Faces Growth Headwinds Amid Strategic Capital Deployment and Segment Evolution
Examines how Markel's specialty insurance expertise and diversified industrial businesses sustained capital returns despite a revenue decline in 2025.
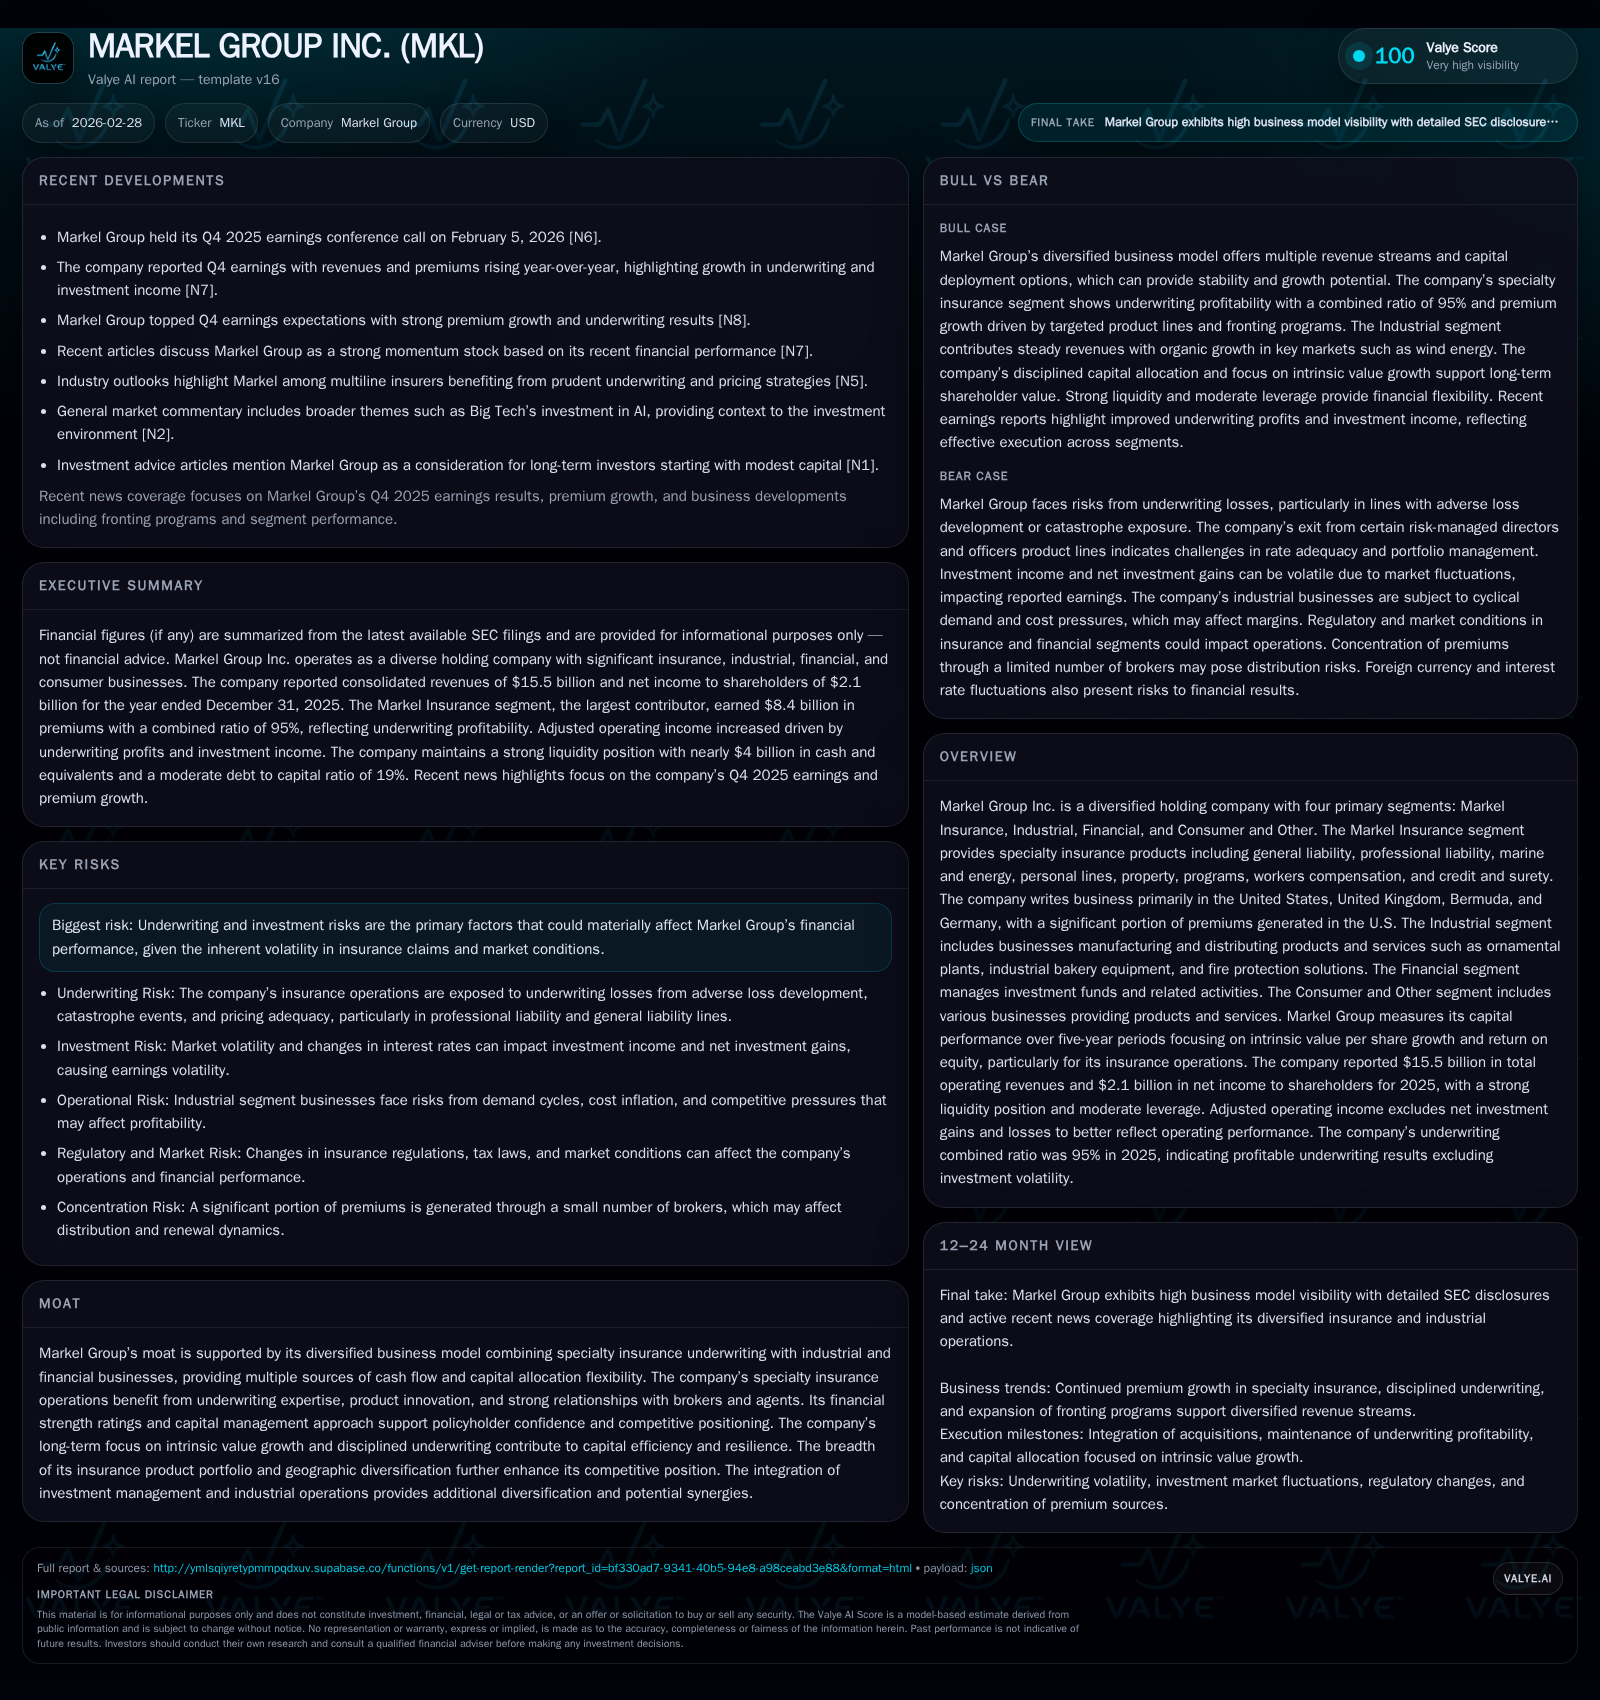
Markel Group reported a 6.7% revenue decline in 2025, weighed by premium softness and evolving segment dynamics, yet maintained underwriting discipline with a 95% combined ratio. Diverse segments—including specialty insurance, industrial operations, and financial services—balanced top-line challenges with resilient cash flow generation and capital allocation flexibility. The company’s five-year focus on intrinsic value per share growth underpinned its disciplined approach to managing underwriting risk, investment volatility, and strategic deployment of capital including $429 million in share buybacks.
2025 Highlights: Navigating Revenue Contraction with Underwriting Resilience
Markel Group experienced a topline contraction of approximately 6.7% in fiscal year 2025, with revenue declining to about $15.5 billion from $16.6 billion the prior year [F1]. This dip was chiefly attributed to lower gross premiums within the Markel Insurance segment, which saw decreased volumes due to selective underwriting actions and the exit from the Global Reinsurance division through run-off initiatives [S1]. Operating income reflected sharper pressure, falling nearly 14% year-over-year to roughly $3.2 billion [F1], while net income declined over 23% to approximately $2.1 billion [F1].
Despite these headline declines, underwriting discipline remained intact as evidenced by a favorable combined ratio of 95%, marking another profitable underwriting year—the eighteenth in two decades for Markel Insurance [S1]. This continued operational profitability amidst revenue headwinds underscores management’s focus on quality over quantity in premium writings.
Operating cash flow remained healthy at nearly $2.76 billion, increasing modestly by over 6% year-over-year [F1], reflecting effective cash generation from ongoing operations despite compressed earnings. Capital expenditures were moderated to approximately $207 million, down about 19% from prior levels [F1], aiding free cash flow generation.
Segment Performance Breakdown: Specialty Insurance’s Stability Meets Industrial Variety
Markel’s diversified business model spans four primary segments with differing drivers shaping results [S6]:
Markel Insurance: Gross premiums totaled around $12.5 billion in 2025, inclusive of $10.6 billion of underwriting premiums plus approximately $1.9 billion earned as fronting premiums—a business model involving ceding premiums wholly to capacity providers while earning ceding fees [S1]. The U.S., making up roughly three quarters of exposure, continued as primary geographic market [S6]. The segment strategically exited its Global Reinsurance unit via run-off during the year; this transition reduced overall premium volume but was managed with loss reserve prudence given multi-year contracts still producing residual earnings [S1]. Product-wise, traditional lines such as general liability, professional liability, marine & energy, personal lines, property, workers compensation, and credit & surety all constituted meaningful premium contributions [S6].
Industrial: Operating revenues grew approximately 4% to about $3.93 billion driven by organic growth (estimated at 2%) complemented by full-year inclusion of recent acquisitions like Valor Environmental [S7]. Core activities include manufacturing (e.g., precast concrete), distribution (building products), equipment leasing notably serving wind energy markets, and fire/life safety solutions. Margins faced compression due to heightened raw material/labor costs but were partially offset by volume gains in services sectors [S7].
Financial: Revenues expanded considerably by around 24%, supported by performance fees linked to insurance-linked securities management as well as income from minority stakes—specifically involvement with Velocity Holdco LLC's divestitures [S21]. Adjusted operating income rose commensurately signaling higher organic growth across program services and lender services [S21].
Consumer and Other: This segment includes ornamental plants, manufactured housing communities, IT consulting services among others; revenues and profitability here maintained steady trajectories reflective of niche but diverse cash flow sources [S6].
This mosaic of complementary businesses allows Markel operational agility but also requires meticulous segmental capital deployment oversight.
Intrinsic Value Growth: The Core Metric Behind Management’s 'Relentless Capital Compounding'
Management emphasizes intrinsic value per share growth over five-year periods as its principal measure of successful capital compounding [S1]. This approach entails valuing adjusted earnings (excluding mark-to-market equity fluctuations within investment portfolios) using consistent multiples centered near 12x earnings followed by balance sheet adjustments incorporating cash equivalents minus debt obligations.
This methodology circumvents short-term volatility inherent to insurance investment cycles or market swings in equity holdings—focusing instead on sustained long-term economic value creation [S1]. Over recent five-year stretches ending in 2025, Markel Insurance alone realized an average annual return on equity approximating 13%, underscoring consistent capital efficiency rooted in disciplined underwriting practices paired with investment acumen [S1].
This metric also guides nuanced capital allocation decisions that prioritize durable growth aligned with shareholder interests.
Capital Allocation Philosophy: Balancing Debt, Share Repurchases, and Strategic Investments
Markel's capital structure remains conservative with total debt-to-capital ratios around targeted leverage ranges [S18]. The holding company boasts approximately $4.4 billion invested assets available for strategic use such as acquisitions or stock repurchases [S5],[S17].
The Company maintains access to a revolving credit facility of $300 million for liquidity flexibility though held no outstanding borrowings on this facility at year-end [S4],[S5]. Long-term senior unsecured notes total just above $4.3 billion with staggered maturities extending into the mid-century timeframe offering refinancing optionality without immediate pressure [S8],[S9].
Shareholder returns featured notable repurchases totaling approximately $429 million in fiscal 2025 under an authorized program capped near $2 billion—of which about $1.5 billion remained available thereafter—displaying continued commitment to returning excess capital efficiently while retaining optionality for reinvestment or M&A pursuits [F1],[S5]. Dividend policies remain supportive though subject to review based on performance trends.
Operating cash flows at $2.76 billion comfortably funded capex ($207 million) plus these buybacks enabling positive free cash flow exceeding $2.55 billion annually—an enviable liquidity runway supporting multiple allocation levers without compromising balance sheet strength [F1].
Risk Landscape: Modeling Uncertainties in Loss Reserves and Market Volatility
Intrinsic risks center around adequacy of loss reserves especially relating to legacy run-off reinsurance exposures where original underwriting decisions were external; resolution timelines remain extended given multi-year tail claims reporting patterns typical within casualty specialties [S24],[S28]. Markel employs comprehensive loss estimation methodologies calibrated across predictive modeling techniques but acknowledges potential uncertainties including emerging claim trends or legal precedent evolution that may alter exposure scope.
Investment risk is non-trivial given substantial equity allocations designed for long-term compounding but subjecting current-period earnings to marked volatility—a factor management explicitly excludes when measuring segment periodic profits but monitors closely for solvency implications [S1],[S22].
Catastrophe exposure heightened due to rising natural event frequencies driven by climate change represents unhedged risk points necessitating robust catastrophe modeling frameworks tied into reinsurance programs minimizing financial damage concentration.
Competitive dynamics transform continuously driven by technological adoption like AI-powered predictive analytics impacting both risk selection efficiency and customer experience—potential disruptors that may require accelerated innovation response lest pricing power erode amid industry digitalization waves [S24],[N10].
Future Outlook: Monitoring Pricing Cycles and Emerging Underwriting Innovation
Looking ahead, Markel anticipates that premium rate environments across specialty insurance lines may experience mixed trajectories reflecting current periods of hardened markets emerging from prior soft cycles compounded by inflationary cost pressures warranting targeted rate increases for sustainable margins [N12],[S1]. Select product innovations piloted leveraging AI tools aim to improve risk assessment accuracy driving enhanced technical pricing precision thus tightening loss ratios over time.
Continued geographic expansion initiatives across Europe via Lloyd's platforms along with Bermuda markets provide diversification benefits; however geopolitical or regulatory changes require vigilant adaptation strategies.
Strategic monitoring of macroeconomic factors affecting insured exposures will also inform agile underwriting posture adjustments amidst uncertain post-pandemic economic normalization phases.
Operational Leverage and Technology Adoption: Potential Catalysts to Watch
Technological investments focused on digitizing workflows within property-casualty underwriting platforms could materialize meaningful operating leverage over forthcoming quarters particularly through enhanced data capture enabling faster quote-to-bind cycles while reducing acquisition expenses measured against earned premiums ratio targets [S16],[N4].
Selective R&D allocations toward fintech integrations complement these efforts supporting seamless client interfacing as well as automated claims adjudication processes potentially shortening settlement durations thereby improving customer retention metrics.
Capturing margin expansion opportunities sustainably requires balancing capex discipline while accelerating technology diffusion—a tradeoff area worth close scrutiny during upcoming quarterly disclosures.
Financial Summary Table
Historical performance (annual)
| FY | Rev ($bn) | Net ($bn) | CFO ($bn) | OpInc ($bn) | Rev YoY | Net YoY |
|---|---|---|---|---|---|---|
| 2025 | 15.5 | 2.1 | 2.8 | 3.2 | -6.7% | -23.3% |
| 2024 | 16.6 | 2.7 | 2.6 | 3.7 | +5.2% | +37.6% |
| 2023 | 15.8 | 2.0 | 2.8 | 2.9 | +35.4% | +1032.2% |
| 2022 | 11.7 | -0.2 | 2.7 | -0.1 |
Source: SEC companyfacts cache [F1].
Capital returns and efficiency (annual)
| FY | Buybacks ($mm) | FCF ($bn) | ROE% |
|---|---|---|---|
| 2025 | 430 | 2.6 | 11.3 |
| 2024 | 573 | 2.3 | 16.2 |
| 2023 | 445 | 2.5 | 13.3 |
| 2022 | 291 | 2.5 | -1.6 |
Source: SEC companyfacts cache [F1]. Note: Percentages are year-over-year changes comparing each fiscal year to its prior period where available.
This analysis is grounded solely on publicly disclosed financial data from SEC filings alongside recent industry news without speculative forecasts or valuation commentary intended for internal strategic review purposes only.
Disclaimer: This is research-only, informational analysis and not investment advice. It may include AI-generated interpretation and general industry context. Always verify important details using primary sources.
Comments