
Optical Cable's Q2 Sales and Backlog Growth Highlight Operational Momentum Despite Financial and Execution Challenges
Optical Cable Corporation’s 27% sales growth and rising backlog reflect robust demand in optical infrastructure, yet ongoing operational execution and liquidity constraints temper near-term outlook.
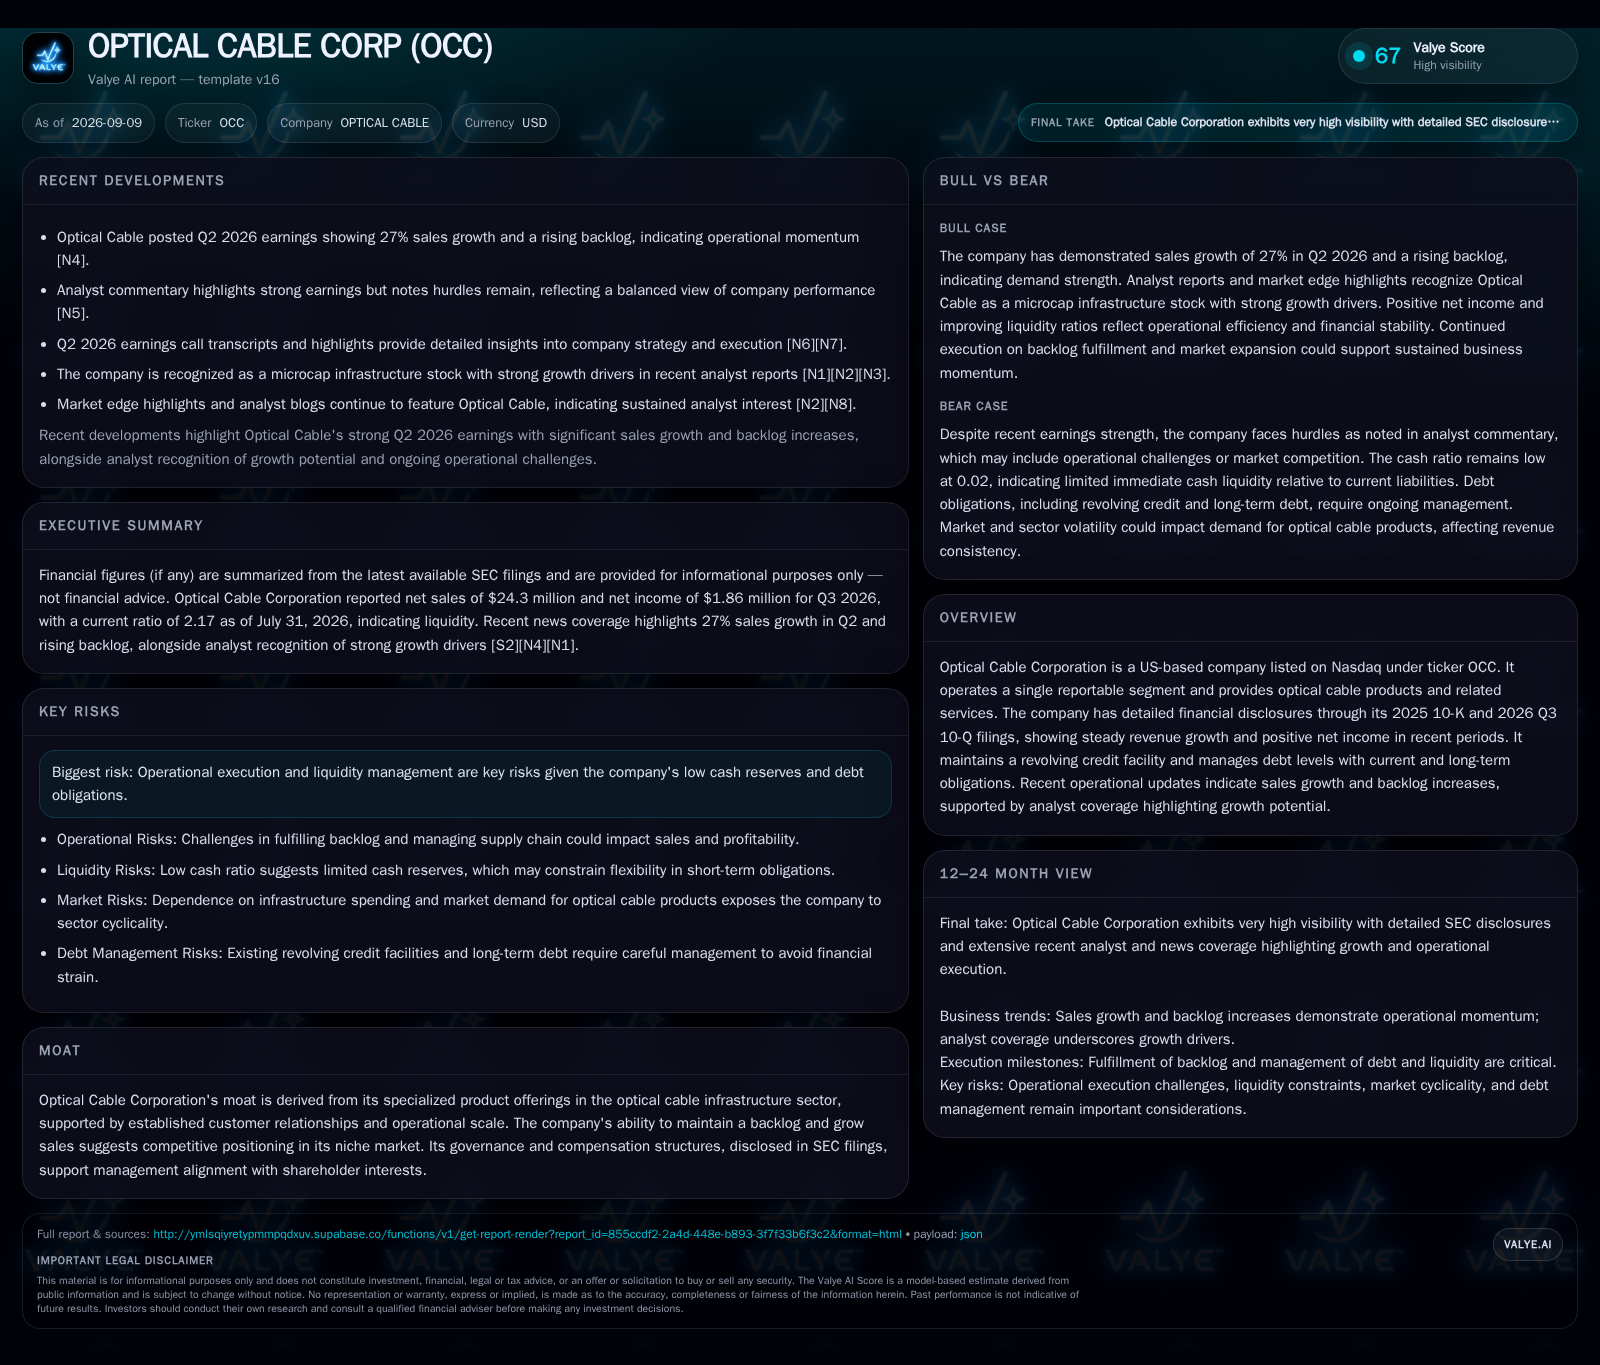
Optical Cable Corporation reported strong Q2 2026 results with 27% sales growth and an increasing backlog, signaling solid demand and operational momentum in the optical cable infrastructure market [N4] [S2]. Positive net income and analyst recognition underscore growth potential, but low cash reserves and debt obligations pose execution and financial risks [N5] [S1]. The company’s business economics hinge on project-based volume with moderate operating leverage, while its competitive position relies on niche product specialization and customer relationships. Upside depends on backlog conversion and market expansion, balanced by execution risks and sector cyclicality. Key watchpoints include backlog fulfillment rates, margin trends, liquidity metrics, and debt management.
Optical Cable Corporation reported significant operational progress in Q2 2026 with a 27% increase in sales and a rising backlog, signaling strengthening demand for its optical cable products in infrastructure markets [N4]. This growth is complemented by positive net income and improving liquidity ratios, reflecting operational efficiency [S2]. However, the company faces notable challenges, including low cash reserves relative to liabilities and ongoing debt obligations, which could constrain flexibility and execution capacity [S1] [N5]. Analyst commentary highlights both the company’s growth potential and operational risks, underscoring the critical importance of backlog fulfillment and prudent financial management to sustain momentum [N5] [N6].
Q2 Sales Increase and Backlog Growth Indicate Demand Strength Amid Financial Constraints
Optical Cable Corporation’s Q2 2026 earnings showcased a 27% increase in net sales to $24.3 million, driven by a rising backlog that suggests robust demand momentum in optical infrastructure projects [N4] [S2]. The positive net income of $1.86 million reflects operational efficiency gains amid this growth phase, while the current ratio of 2.17 indicates reasonable short-term asset coverage of liabilities [S2].
Despite these strengths, the company’s cash ratio remains notably low at 0.02, highlighting limited immediate cash liquidity relative to current liabilities and raising concerns about short-term financial flexibility [S1]. Analyst reports acknowledge the growth trajectory but caution about operational execution risks and the challenges posed by the company’s debt structure [N5] [S1]. These dynamics frame a nuanced picture of opportunity tempered by financial and operational constraints.
Project-Driven Revenue with Moderate Operating Leverage and Capital Discipline
Optical Cable’s revenue model predominantly relies on project-based sales of specialized optical cable products and related services, where pricing is influenced by contract terms, volume, and mix of product offerings. Given the infrastructure nature of the business, fixed costs related to manufacturing facilities and R&D create a moderate fixed-cost base, enabling some operating leverage as sales scale, though unit-level volume data are not disclosed [S1].
Capital expenditure requirements remain modest relative to revenue, reflecting a focus on manufacturing and supply chain management rather than heavy physical asset investment. The presence of a revolving credit facility and long-term debt requires disciplined working capital and cash flow management, as delays in backlog conversion or cost overruns could compress margins and leverage operating expenses. Thus, the business exhibits a balance of volume-driven revenue dynamics and capital-light operational intensity.
Niche Specialization and Customer Relationships Anchor Position but Market Cyclicality Persists
Optical Cable’s competitive edge stems from its focused offering of optical cable products tailored to infrastructure buildouts, supported by established customer relationships and a growing backlog that provides revenue visibility [N4] [S1]. This specialization could increase switching friction for customers seeking tailored solutions, which may support pricing discipline and retention.
However, the market remains subject to cyclicality tied to infrastructure spending and technological shifts. Competitive pressure arises from both larger diversified players and niche specialists, making continuous innovation and supply chain reliability critical. The company’s scale as a microcap infrastructure stock imposes limits on cost advantages and market reach, requiring ongoing operational excellence to sustain its position [N1].
Backlog Conversion and Market Expansion Support Accelerating Growth and Margin Expansion
In an optimistic scenario, Optical Cable successfully converts its growing backlog into revenue with minimal execution delays, benefiting from sustained demand in optical cable infrastructure projects [N4]. This would enhance sales momentum beyond the reported 27% growth, enabling operating leverage to improve margins through fixed-cost absorption and manufacturing efficiencies.
Expansion into adjacent markets or new geographies could diversify revenue streams and reduce exposure to cyclical infrastructure spending patterns. Confirmation of this scenario would include consistent backlog fulfillment rates, stable or expanding gross margins, and positive cash flow trends despite debt service requirements. Conversely, failure to meet backlog schedules or margin compression from competitive pricing would falsify this outlook.
Backlog Fulfillment Progresses with Debt and Operational Constraints
The most plausible path involves steady execution of backlog orders, translating into moderate revenue growth consistent with recent trends but limited by operational bottlenecks and supply chain variability [N6] [N7]. Earnings improve incrementally as management balances growth with cost control, though margin expansion remains modest due to pricing pressures and input cost inflation.
Debt and liquidity are managed conservatively, with no significant deleveraging but stable compliance with credit covenants. This scenario is confirmed by stable quarterly sales growth, consistent margin profiles, and controlled working capital metrics. A deviation toward either breakthrough growth or financial distress would invalidate this middle path.
Execution Delays and Liquidity Strains Risk Growth and Margin Stability
Downside risks materialize if Optical Cable encounters significant operational hurdles, including supply chain disruptions or backlog fulfillment delays, which could stall revenue growth and increase fixed-cost burdens [N5] [S1]. Such disruptions may force pricing concessions in a competitive market, eroding margins and profitability.
Liquidity pressure from the low cash ratio and existing debt facilities could constrain the company’s ability to invest in growth or absorb shocks, potentially leading to covenant breaches or higher financing costs. Confirmation of this scenario would be prolonged margin contraction, negative free cash flow, or increasing leverage ratios, while signs of backlog recovery or liquidity improvement would counter this outcome.
Backlog Conversion Rates, Margin Trends, and Liquidity Metrics Will Clarify Growth Sustainability
A critical metric to monitor is the rate at which Optical Cable converts backlog into recognized revenue, which will indicate operational execution effectiveness and near-term growth visibility. If disclosed, the average backlog duration and fulfillment cycle times would provide valuable insights.
Gross and operating margin trends will reveal whether the company is successfully leveraging scale and managing input costs amid competitive pressures. Monitoring changes in cost structure or pricing dynamics would help assess margin sustainability.
Liquidity indicators, especially improvements or deterioration in the cash ratio and free cash flow generation, will be essential to evaluate financial flexibility and risk. Debt covenant compliance and refinancing terms are also key to watch given the company’s leverage profile.
Additional useful metrics include customer concentration and repeat order rates, which would help assess revenue stability and switching risks. Finally, tracking analyst revisions and market share data could provide external validation of competitive positioning and growth prospects.
Disclaimer: This is research-only, informational analysis and not investment advice. It may include AI-generated interpretation and general industry context. Always verify important details using primary sources.

Comments