
Skyline Bankshares Expands Regional Footprint While Reinforcing Capital Strength
Skyline Bankshares has grown through targeted acquisitions and prudent lending, maintaining robust capital ratios amid regional economic headwinds.
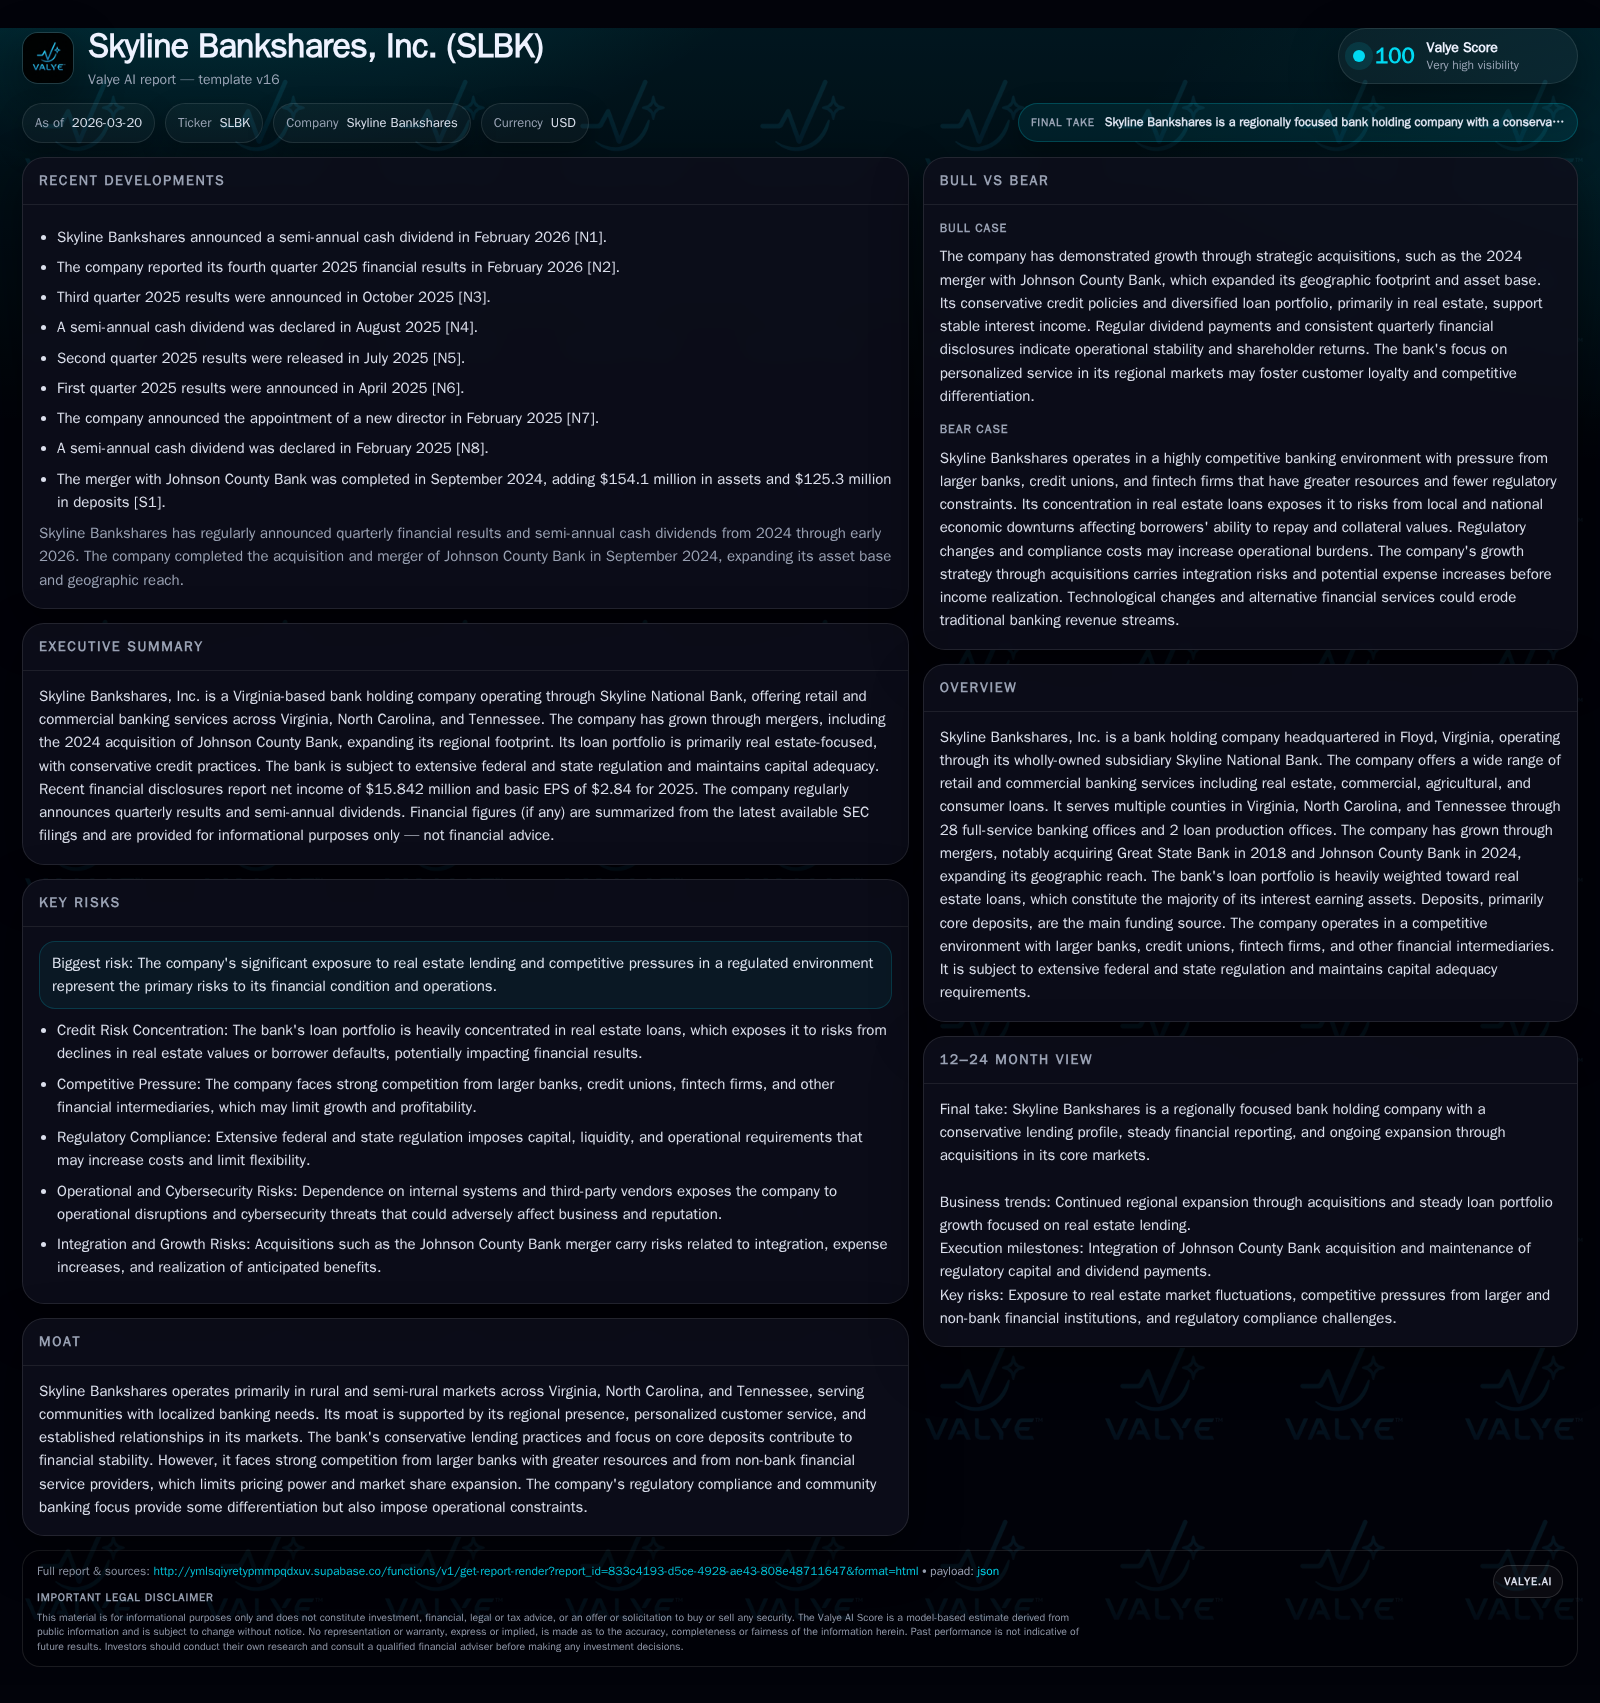
Skyline Bankshares, Inc. transformed from a local Virginia bank into a multi-state regional player by acquiring Great State Bank in 2018 and Johnson County Bank in 2024, which expanded its footprint across Virginia, North Carolina, and Tennessee [S1]. The loan portfolio remains heavily concentrated in real estate loans, comprising over 93% of total loans, but the bank employs conservative underwriting and loan-to-value ratios to mitigate risks [S6][S8]. Despite macroeconomic challenges in its Appalachian markets, including declines in furniture and textile industries and inflationary pressures, Skyline sustains a solid capital position with a Tier 1 risk-based capital ratio above regulatory minimums and a strong approximate ROE of 14.7% for FY2025 [F1][S5]. The company reported a significant net income increase of 113% YoY in 2025, driven largely by the acquisition of Johnson County Bank and organic growth, while continuing to pay steady dividends supported by free cash flow generation [F1][N1]. Going forward, competitive pressures from larger banks and fintech firms alongside local economic dynamics are key variables influencing loan growth and asset quality [S14].
Transforming Through Mergers: Growth History and Portfolio Shifts
Since adopting the Skyline brand in 2017 following earlier consolidations among Grayson Bankshares and Cardinal Bankshares, Skyline Bankshares has leveraged strategic acquisitions to diversify its geographic presence across Virginia, North Carolina, and Tennessee. The acquisition of Great State Bank in mid-2018 marked its first major expansion beyond the original market. More recently, in September 2024, the acquisition of Johnson County Bank anchored Skyline’s entry into Eastern Tennessee via an all-cash transaction valued at $25 million that added $154.1 million in assets including $87.2 million in loans along with $125.3 million of core deposits assumed [S1][S4].
These mergers underpin the company’s financial growth trajectory. Annual net income declined between FY2022 ($10.28 million) and FY2024 ($7.43 million), partly reflecting integration costs and regional economic softness; however, FY2025 reversed this trend dramatically to $15.84 million—a doubling year-over-year—highlighting earnings impact from JCB’s acquisition alongside organic momentum [F1]. Operating cash flow rose nearly 47% to $18.77 million while equity capital increased over 21% to approximately $107.7 million by end-2025.
Historical performance (annual)
| FY | Net ($mm) | CFO ($mm) | Capex ($mm) | Net YoY |
|---|---|---|---|---|
| 2025 | 16 | 19 | 8 | +113.4% |
| 2024 | 7 | 13 | 4 | -23.5% |
| 2023 | 10 | 11 | 3 | -5.7% |
| 2022 | 10 | 11 | 4 |
Source: SEC companyfacts cache [F1].
Capital returns and efficiency (annual)
| FY | Div ($mm) | Buybacks ($) | FCF ($mm) |
|---|---|---|---|
| 2025 | 3 | 0 | 11 |
| 2024 | 3 | 230000 | 9 |
| 2023 | 2 | 508000 | 9 |
| 2022 | 2 | 154000 | 7 |
Source: SEC companyfacts cache [F1].
The mergers shifted Skyline’s balance sheet composition markedly toward real estate lending while broadening deposit funding sources across tri-state borders.
Balancing Real Estate Concentration with Conservative Credit Practices
Real estate secured loans dominate Skyline’s portfolio at over 93% of total loans ($987.1 million at December 31, 2025), concentrated largely in residential single- and multi-family housing (56.35%), commercial real estate (28.61%), farm-related loans (2.19%), and construction/development financing (6.13%) [S6][S8]. Commercial/agricultural production loans constitute about 5.38%, with consumer loans roughly at 1.34%.
Management emphasizes prudent underwriting frameworks: conservative loan-to-value ratios safeguard collateral coverage; approvals undergo layered scrutiny — the Officers Loan Committee authorizes loans up to $3 million exposure; Directors’ Loan Committee reviews exposures between $3 million and $4.5 million; anything exceeding requires full board approval [S6]. This governance helps contain credit risk concentration within a real estate-heavy book.
The allowance for credit losses reflects ongoing assessment incorporating local economic conditions plus borrower financial strength; nevertheless there are inherent limitations predicting future default patterns especially amid cyclical local industries which could elevate nonperforming loans if adverse shocks occur [S13].
Assessing Macroeconomic Challenges in Appalachian Markets
Skyline operates predominantly across rural Appalachian counties spanning southwestern Virginia, northwestern North Carolina, and eastern Tennessee where economic fundamentals exhibit structural pressures: protracted decline in furniture manufacturing and textiles undermines employment rates; inflationary trends squeeze disposable incomes; labor shortages constrain business expansion; supply chain constraints persist—all compounding Federal Reserve-driven interest rate increases raising borrowing costs for new credit demands [S1].
These factors curtail deposit growth potential and heighten risk exposure within the localized bank footprint since community banks rely on vibrant regional economies supporting customer repayments alongside core deposit accumulation.
Capital Structure Health and Regulatory Compliance Metrics
Skyline holds capital comfortably above minimum well-capitalized thresholds required by FDICIA embedded Basel III norms: it satisfies Tier 1 risk-based capital ratio limits at or exceeding defined buffers (total capital ratio ≥10%, common equity Tier 1 ≥6.5%, Tier 1 ≥8%, leverage ratio ≥5%) with leverage cushions preventing regulatory restrictions on dividends or share repurchases absent material earnings deterioration [S5][F1].
Management indicates compliance with community bank leverage ratio provisions though has elected not yet to opt into the simplified CBLR framework available for institutions under $10 billion but may reconsider depending on balance sheet evolution [S5].
Return on equity is approximated at a healthy ~14.7% for FY2025 corroborating effective capital utilization amidst growth initiatives securing shareholder value through prudent balance sheet management [F1].
Dividend Track Record and Capital Allocation Policy
Skyline maintains a semi-annual cash dividend policy recently declaring $0.30 per share in February 2026 reflecting confidence bolstered by its approximately $10.65 million free cash flow generation for FY2025 after accounting for capex expenditures totaling just over $8 million indicating deployment towards technology or branch improvements concurrent with merger integrations [N1][F1][S15].
Share repurchases were modest historically ($154k–$508k range pre-2024) but ceased since FY2024 signaling cautious capital deployment aligned with integration spending post-JCB acquisition ensuring liquidity preservation amid competitive headwinds [F1][S28].
Liquidity Position and Interest Rate Risk Management Overview
Liquidity composition remains favorable balancing predominantly core deposits (~90%) supplemented by federal funds sold lines alongside correspondent banking facilities providing transactional agility essential during times of market uncertainty or depositor behavior shifts associated with rural demographics’ sensitivity towards rate competition versus national banks offering promotional yields [S4][S7][S16].
Interest rate volatility remains a key risk factor given pass-through mechanics impacting net interest margin where higher wholesale funding costs could compress spreads if deposit pricing escalates rapidly requiring careful gap management dynamically adjusted through asset-liability oversight combined with stress testing based on Fed assumptions.
What Investors Should Watch Next: Key Milestones Ahead
Key near-term issues will hinge upon quarterly results illuminating:
- Integration progress metrics reflecting JCB consolidation synergies,
- Credit quality trends within highly concentrated real estate portfolio segments,
- Deposit growth velocity amid competition juxtaposed with local economy recalibrations,
- Regulatory developments affecting capital distribution capacity such as dividend changes or buyback program resumption aligned with evolving capital adequacy assessments,
- Responses to technological challenges confronting community bank service delivery models facing digital-native non-bank disruptors.
Monitoring these developments within upcoming earnings reports will yield insight into Skyline’s execution credibility regarding strategic ambitions versus operational realities grounded in local economic constraints.
This report synthesizes public filings including the latest Form 10-K dated March 20, 2026 [S1],[S4],[S5],[S6],[S7],[S13],[S14],[S15], relevant SEC quarterly updates, company press releases on dividend declarations from February 20, 2026 [N1], alongside numeric datasets extracted from official SEC XBRL sources dated through FY2025 end-point values [F1], strictly avoiding speculative extrapolations.
Disclaimer: This is research-only, informational analysis and not investment advice. It may include AI-generated interpretation and general industry context. Always verify important details using primary sources.
Comments