
Vicor Corp's Breakthrough Profit Surge and Growth Transition in 2025
Vicor achieved a dramatic financial turnaround in 2025 driven by advanced power technologies and strategic product shifts.
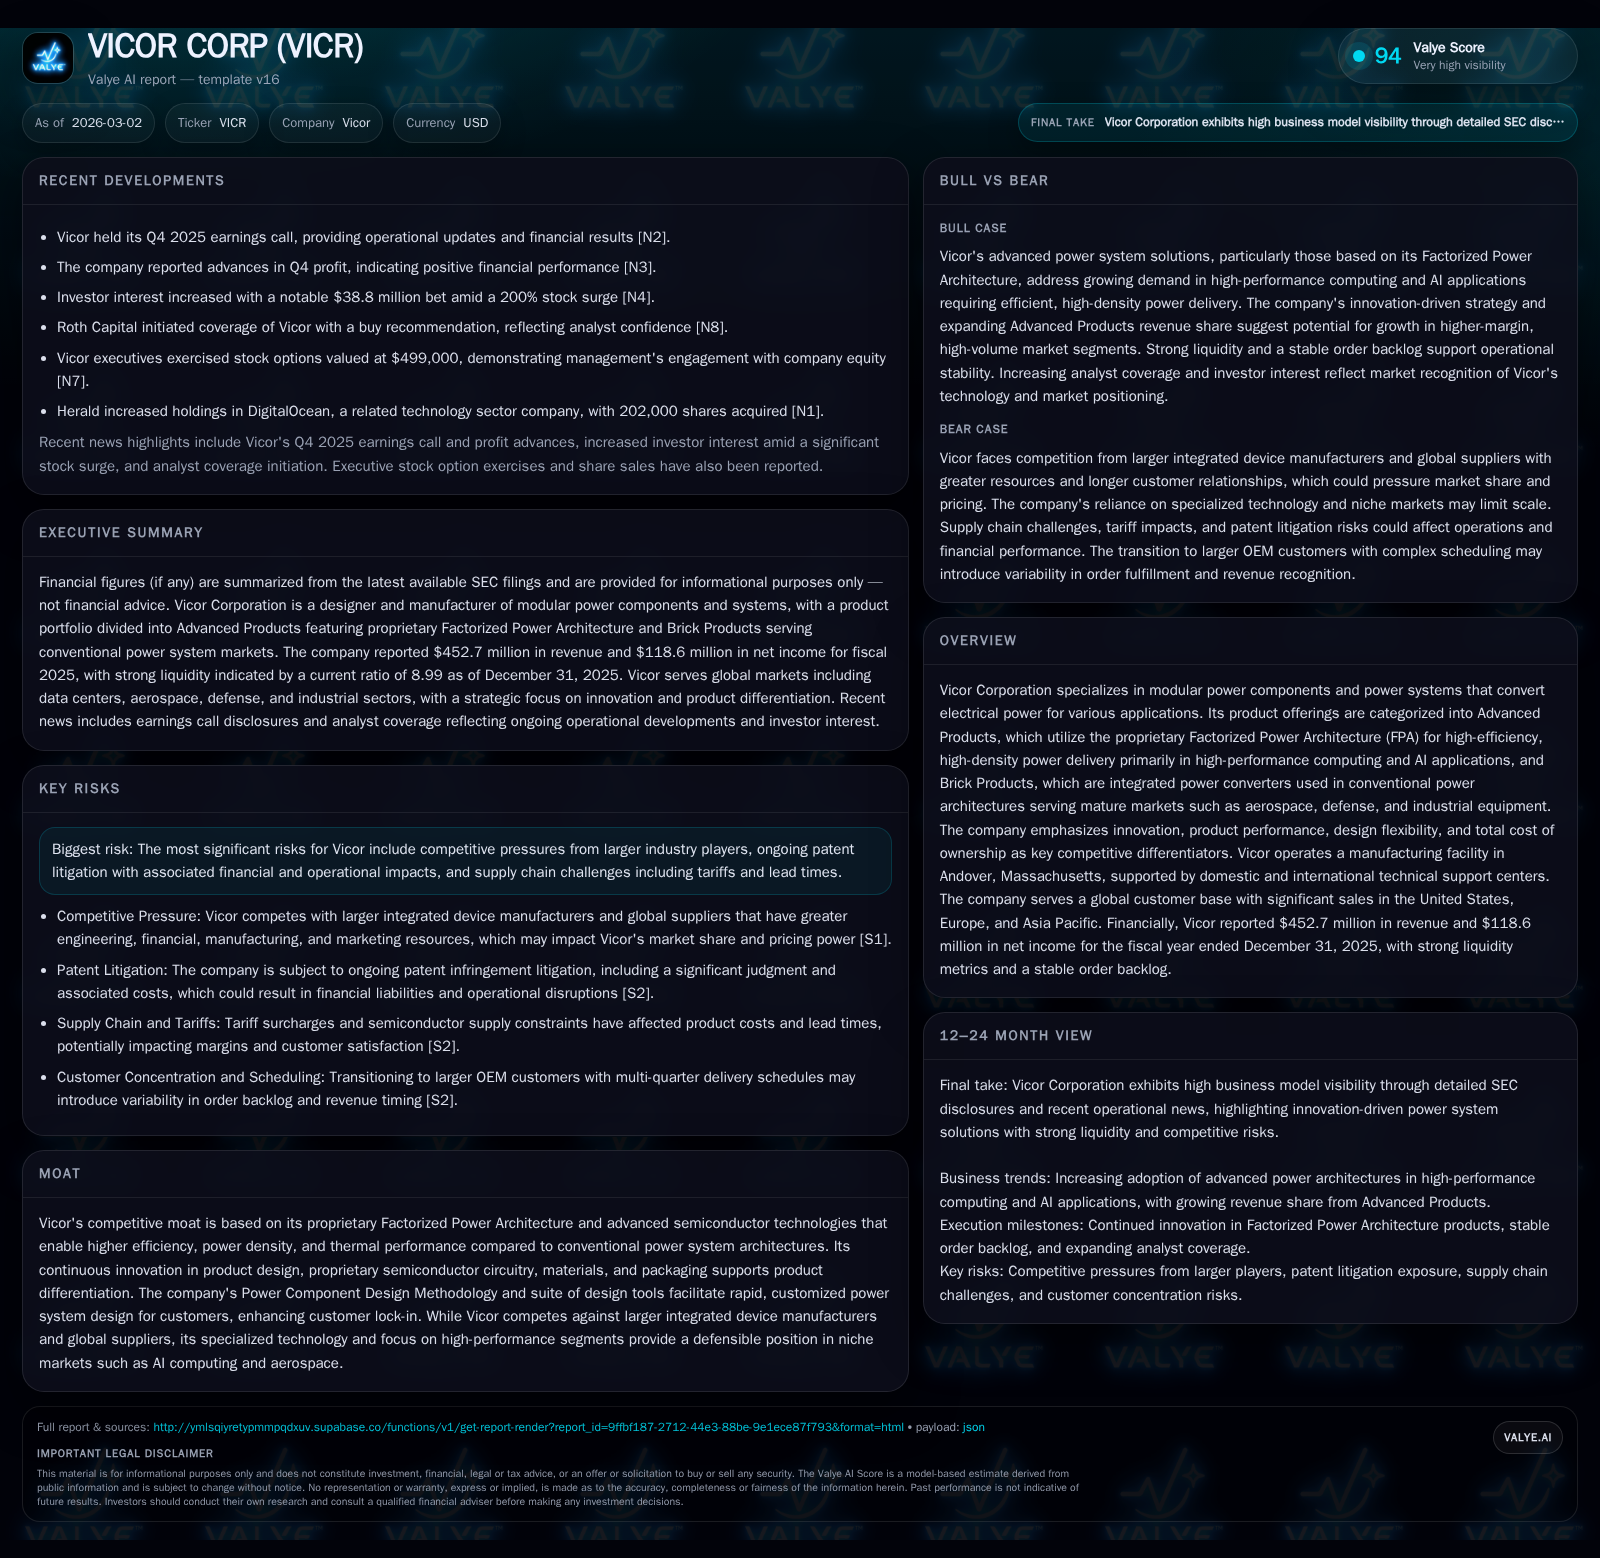
In fiscal year 2025, Vicor Corporation reversed prior operating losses to report record profitability, fueled largely by its proprietary Factorized Power Architecture and an increasing revenue contribution from high-margin Advanced Products. The company’s revenue rose to $453 million while operating income surged over 6300% year-on-year, marking a fundamental shift in its business trajectory. Challenges from patent litigation, supply chain constraints, and market concentration persist, but strong cash flow generation and disciplined capital allocation position Vicor for further growth in AI computing and electrification sectors.
Financial Momentum: From Losses to Record Profits
Fiscal year 2025 marked a watershed for Vicor Corp with operating income rocketing to $81.8 million from approximately a $1.3 million operating loss in 2024 — a staggering increase of over 6300% year-over-year [F1]. Top-line revenue rose to $452.7 million, reflecting reinvigorated sales traction across the firm's portfolio. Net income surged similarly, reaching $118.6 million, nearly 18 times the modest profit recorded in the prior year [F1]. This remarkable earnings leap materialized despite persistent headwinds such as Section 301 tariffs on Chinese imports that increased by over 76% versus prior year to more than $7 million, detracting from gross margins [S10].
Operating cash flow more than doubled to about $139.5 million, underscoring improved working capital management and robust underlying profitability [F1], supported by disciplined expense control as evidenced by a reduction in capital expenditures to $20.3 million from over $23.6 million the prior year [F1]. Management highlighted strong sales execution in hyperscale data center customers during its Q4 earnings commentary, emphasizing improved margin profiles attributed to product mix shifts favoring high-value Advanced Products [N1],[N3].
Driving Technology: The Factorized Power Architecture Advantage
Vicor’s competitive differentiation rests on its proprietary Factorized Power Architecture™, an innovative modular power system enabling high-efficiency and ultra-high power density distribution solutions critical for AI-optimized computing applications [S8]. This architecture modularizes voltage conversion functions such as transformation, isolation, rectification, and regulation into specialized components optimized for performance and flexibility.
This architectural innovation translates into superior thermal performance and energy efficiency at scale—enabling system designers to meet stringent data center power delivery requirements while minimizing total cost of ownership. Vicor supports this with continued investment in research and development focused on advanced semiconductor circuitry and packaging innovations [S20].
Product Mix Shift: Advanced Products Supplant Legacy Lines
The portfolio realignment towards Advanced Products has accelerated materially. These offerings now outpace Brick Products—a line of integrated power converters serving mature aerospace, defense, industrial markets that still account for about 39% of total revenues down from near half several years ago—reflecting changing market dynamics and innovation priorities [S15],[F1].
This strategic pivot has positive margin implications due to higher value-add content in Advanced Products coupled with efficiencies gained through expanded manufacturing capacity at the Andover facility adapted for modular power components rather than just conventional bricks [S19]. However, this transition introduces operational complexity requiring robust global field applications engineering support through multiple Technical Support Centers worldwide [S13].
Global Market Footprint and Key Customer Dynamics
Vicor maintains a broad international presence with roughly half of revenues derived outside the United States; Asia-Pacific region contributed significantly to growth with revenues increasing notably due to demand from hyperscale technology companies headquartered there as well as contract manufacturers [S13],[S23]. European sales are stable yet less dominant in product mix driven primarily by Brick Product demand.
Customer concentration remains notable with several large OEM accounts heavily influencing quarterly results; managing order timing variability from these few key players continues to pose risk of revenue fluctuation quarter-over-quarter [S9],[N1]. Government budget scenarios notably impact defense-related Brick Product sales though these remain a smaller proportion overall.
Capital Allocation: Balancing Growth Investment with Returns
Vicor’s balance sheet strength underpinned solid capital deployment choices in FY2025. With cash and equivalents exceeding $400 million against current liabilities near $65 million, liquidity is ample for ongoing growth investments and opportunistic share repurchases while avoiding leverage buildup [F1],[S14]. Free cash flow approximated $119 million after capex absorption reflecting operational efficiency gains.
While no dividends were declared or paid as management targets reinvestment into innovation capacity expansion, stock buybacks increased substantially—to about $35.2 million compared with under half a million in FY2024—signaling confidence in valuation levels without risking balance sheet flexibility [F1],[N3]. Return on equity stands near 16.7%, highlighting effective capital utilization bolstered by tripling net income amid moderate equity growth over recent years [F1].
Risk Profile: Litigation, Supply Chain, and Competitive Pressures
Principal risks facing Vicor include ongoing complex patent litigation which has resulted in accruals totaling approximately $26 million as of mid-2025 related to infringement claims; these legal costs weigh on SG&A expense lines and could escalate depending on developments including pending appeals [S4],[S5],[S17]. Additionally, supply chain challenges persist notably around sourcing proprietary semiconductor materials amid tariff pressures—tariff costs surged over 75% inflating COGS despite recovery efforts via duty drawback filings totaling under $1 million recently with uncertain future reimbursements [S10],[S20].
Competitive pressures stem chiefly from larger semiconductor integrated device manufacturers pursuing aggressive pricing strategies that test Vicor’s ability to sustain premium pricing based on innovation-led differentiation; failure to keep pace technologically or cost-wise could erode market share particularly within price-sensitive Brick Product segments [S6],[N1]. Moreover, concentrated revenue streams owing to reliance on few major OEMs intensify risks if customer spending plans shift abruptly.
Operational risks include maintaining effective internal controls over financial reporting amidst regulatory compliance demands and cybersecurity vulnerabilities heightened by AI integration efforts—underscoring the importance of continuous governance enhancements flagged in recent filings [S11],[S29].
Forward Signals: What Earnings Calls and Filings Reveal About Future Trajectory
Management commentary during the February 2026 Q4 earnings call reinforced optimism regarding Vicor’s penetration into AI compute infrastructure markets with new product introductions designed for next-generation servers scheduled throughout 2026; nevertheless capacity constraints linked to specialized component lead times could cap near-term ramp speed requiring careful supply chain stewardship [N1],[S28]. Guidance remains conservative reflecting historical volatility though backlog increased sequentially by roughly $21 million year-over-year indicating firm underlying demand.
Investor focus should track quarterly order intake trends within Advanced Product lines—especially automotive electrification engagements targeting multiple voltage tiers (48V/400V/800V) supporting hybrid/electric vehicle architectures—as well as any regulatory or litigation developments that might influence margins or R&D resource allocation moving forward.
Key Metrics Snapshot: Historical Performance Trends at a Glance
Historical performance (annual)
| FY | Net ($mm) | CFO ($mm) | OpInc ($mm) | Capex ($mm) | Net YoY |
|---|---|---|---|---|---|
| 2025 | 119 | 140 | 82 | 20 | +1834.3% |
| 2024 | 6 | 51 | -1 | 24 | -88.6% |
| 2023 | 54 | 75 | 51 | 33 | +110.6% |
| 2022 | 25 | 23 | 27 | 64 |
Source: SEC companyfacts cache [F1].
Capital returns and efficiency (annual)
| FY | Buybacks ($mm) | FCF ($mm) | ROE% |
|---|---|---|---|
| 2025 | 35 | 119 | 16.7 |
| 2024 | 0 | 27 | 1.1 |
| 2023 | 41 | 9.9 | |
| 2022 | -41 | 5.5 |
Source: SEC companyfacts cache [F1].
Note: Operating income growth reflects turnaround from loss to robust profitability along with expanding net income leveraging scalable cash flows. Capex reduction aligns with investment cycle transitioning from brick-focused production.
This analysis reflects information disclosed through official SEC filings up to March 2nd, 2026 ([F1],[S#]) and verified public sources ([N#]). It does not speculate beyond company-reported data or documented numeric trends.
This memorandum is intended solely for informational purposes and does not constitute investment advice or recommendations.
Disclaimer: This is research-only, informational analysis and not investment advice. It may include AI-generated interpretation and general industry context. Always verify important details using primary sources.
Comments