
Cactus Inc. Navigates Cyclical Oilfield Equipment Demand with Modest Margin Pressure
Cactus, Inc. experienced a revenue contraction in 2025 as oil and gas sector volatility tempered demand for its pressure control and spoolable pipe products.
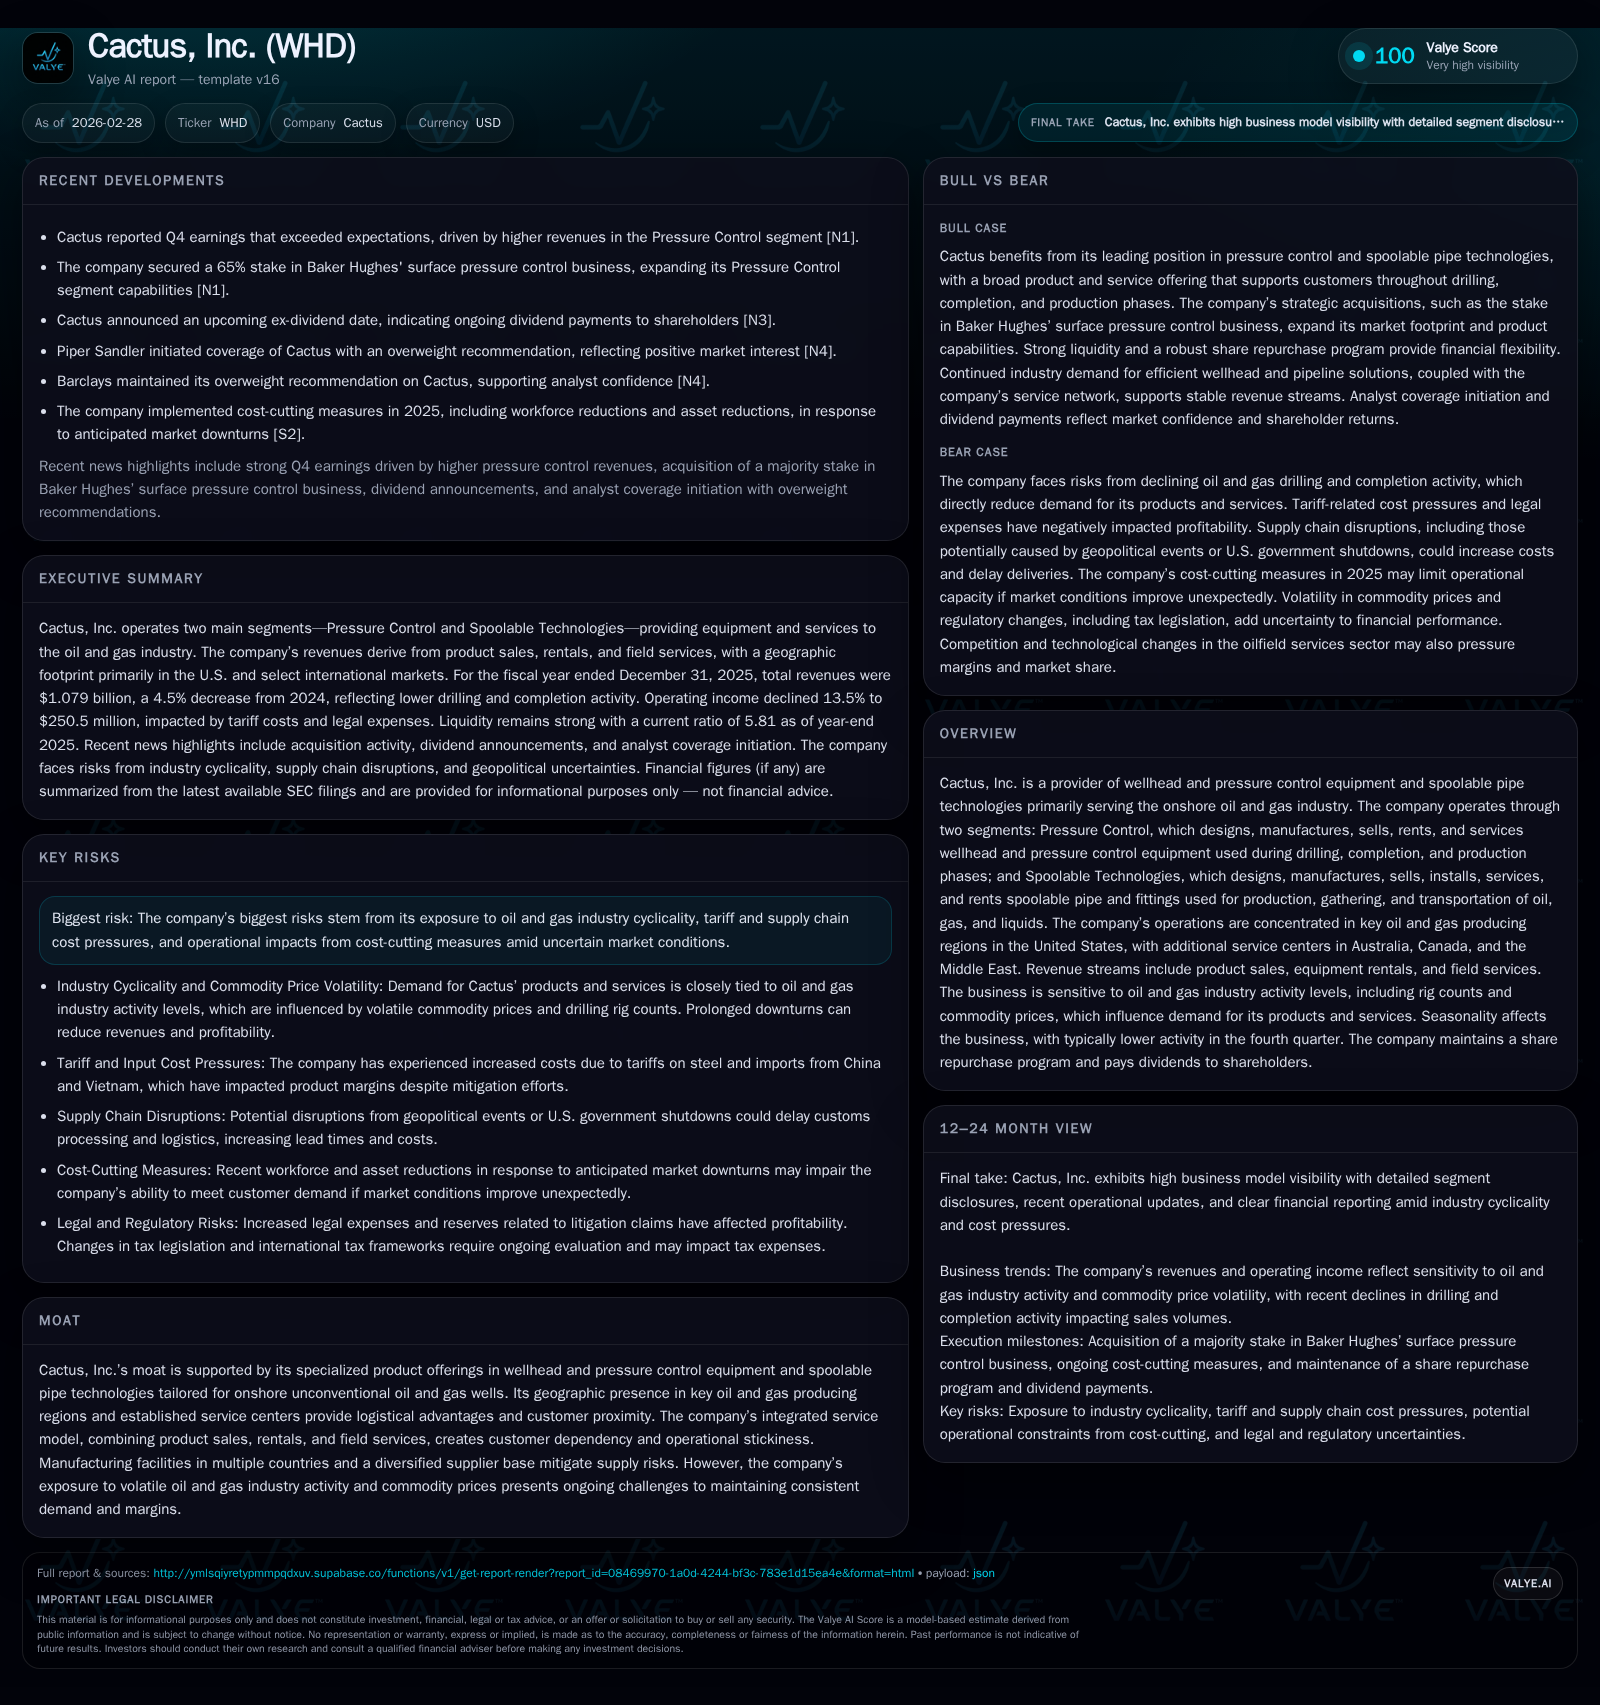
Cactus, Inc., specializing in wellhead and pressure control equipment along with spoolable pipe technologies, reported declines in revenues and earnings in 2025 reflecting softer upstream oil and gas activity. Operating income decreased by over 13% year-over-year, while the company maintained strong operating cash flows and a solid balance sheet with no debt. Future growth hinges on oilfield activity recovery, capital expenditure discipline, and ongoing cost management amid tariff-driven supply inflation. Capital returns include steady dividends and limited share repurchases.
Company Overview
Cactus, Inc. (WHD) designs, manufactures, sells, rents, and services engineered wellhead and pressure control equipment alongside spoolable pipe technologies primarily for onshore unconventional oil and gas wells. The company operates two segments: Pressure Control (wellheads, production trees, frac tree rentals) and Spoolable Technologies (FlexSteel branded spoolable pipes and fittings for production gathering).
Operations are concentrated mainly in key U.S. hydrocarbon basins with service centers also in Australia, Canada, the Middle East, and manufacturing facilities in Louisiana, Texas, China, and Vietnam—the latter having recently commenced production [S1][S6][S17].
The company's end markets depend heavily on upstream drilling rig counts, well completions (notably hydraulic fracturing which drives frac tree rentals), and newly producing wells requiring wellheads or spoolable pipes for takeaway pipelines.
Historical Financial Performance
Cactus’s financial results from 2022 through 2025 reflect the cyclicality of the oilfield services sector:
Historical performance (annual)
| FY | Net ($mm) | CFO ($mm) | OpInc ($mm) | Capex ($) | Net YoY |
|---|---|---|---|---|---|
| 2025 | 166 | 258 | 251 | 1791000 | -10.5% |
| 2024 | 185 | 316 | 290 | 1150000 | +9.6% |
| 2023 | 169 | 340 | 264 | 1997000 | +53.5% |
| 2022 | 110 | 118 | 175 | 1369000 |
Source: SEC companyfacts cache [F1].
Capital returns and efficiency (annual)
| FY | Buybacks ($mm) | FCF ($mm) | ROE% |
|---|---|---|---|
| 2025 | 6 | 257 | 13.5 |
| 2024 | 9 | 315 | 17.3 |
| 2023 | 5 | 338 | 19.5 |
| 2022 | 5 | 117 | 19.3 |
Source: SEC companyfacts cache [F1].
*Note: Revenue not explicitly available for FY2022.
Operating income peaked during market strength in early post-pandemic recovery years before easing in late-2025 due to softer rig activity and elevated raw material tariffs impacting margins [F1][S19][S25]. Operating cash flow remains solid despite a downward trend aligned with earnings.
Revenue Composition & Segment Analysis
Pressure Control accounts for approximately two-thirds of revenue, driven by sales of wellheads for new wells plus rental equipment supporting completions such as frac trees essential for hydraulic fracturing operations.
Spoolable Technologies contributes about one-third of revenue through spoolable pipeline systems used for production gathering that accelerate bringing wells online.
Growth drivers historically included shale expansions while recent weakness reflects capital discipline amid commodity price pressures reducing drilled/completed well counts [S1][S17]. Raw material cost inflation from tariffs impacts manufacturing costs across both segments though diversified sourcing partially offsets these effects [S19][N1].
Capital Allocation & Liquidity
Cactus maintains a conservative capital structure with no borrowings drawn against its amended asset-based revolving credit facility providing up to $225 million availability plus an undrawn $100 million delayed-draw term loan facility established late-2025 [S4][S5]. As of December 31, 2025, unrestricted cash stood near $124 million; restricted escrow funds related to closed acquisitions were released early January 2026 [F1][S16].
Capital expenditures remain modest relative to free cash flow generation ($1.8 million capex vs approximately $256.6 million free cash flow), allocated toward expanding international manufacturing capacity including the Vietnam plant and supply chain diversification amid tariff risks [S12][S18].
Dividend payments rose steadily to $37.8 million in the latest year reflecting continued shareholder return commitment despite industry softness [F1][N3]. Share repurchases have been limited recently under an authorized program allowing up to $150 million in total repurchases; approximately $146 million remains available as buybacks pause awaiting improved market conditions [S14].
Future Growth Prospects & Risks
Growth Opportunities
Recovery in U.S land drilling rigs and well completions will drive demand for both wellhead equipment and spoolable pipe installations as operators seek faster production ramp-ups.
Enhancements to hydraulic fracturing efficiency requiring proprietary rental tools or expanded service offerings provide incremental upside within Pressure Control.
International expansion initiatives including joint ventures in Vietnam support geographic diversification beyond North America’s core basins [S18][N4].
Risk Factors
Commodity price volatility influences exploration budgets directly affecting order flow via rig count fluctuations; tariff-driven raw material cost inflation strains margins particularly on legacy manufacturing bases reliant on steel inputs from China/Vietnam [S19][N2].
Supply chain disruptions—such as those potentially arising from U.S government shutdowns—pose operational risks given global sourcing dependencies across multiple regions served [S2][N2]. Cost-cutting during downturns may restrict responsiveness if market rebounds abruptly thereby risking customer satisfaction or lost sales opportunities [S2][N2].
What to Watch Forward (Analysis)
Without explicit forward guidance beyond Q4 earnings commentary noting improving price realizations partially offsetting volume softness [N1], investors should monitor:
- Trends in U.S active rig counts signaling potential upticks in drilling and completions.
- Tariff developments impacting raw material input costs.
- Progress on international manufacturing capacity expansions mitigating input cost vulnerabilities.
- Dividend announcements reflecting confidence in cash flow stability.
- Share repurchase activity indicating board capital allocation priorities.
Summary Table: Select Financials (USD millions)
| Year-End | Revenue | Operating Income | Net Income | Operating Cash Flow | Capex |
|---|---|---|---|---|---|
| Dec '25 | 1,079 | 251 | 166 | 258 | 1.8 |
| Dec '24 | 1,130 | 290 | 185 | 316 | 1.15 |
| Dec '23 | 1097 | 264 | 169 | 340 | 2 |
Conclusion
Cactus Inc.’s leadership in engineered wellhead equipment combined with spoolable piping systems secures its position within North American onshore oilfield supply chains complemented by growing international footprints easing geographic concentration risks. Near-term profitability faces headwinds from cyclical upstream spending patterns and persistent raw materials cost inflation constraining revenue momentum entering mid-2026. Operating leverage offers upside when volumes recover while prudent capital deployment focused on manufacturing efficiency improvements alongside balanced shareholder returns underpin stable financial footing amid industry cycles. Investors should closely track rig trends coupled with tariff outlooks shaping input costs as key factors influencing Cactus’s medium-term trajectory.
Disclaimer: This report is based solely on publicly available data as of February 28, 2026; it does not constitute investment advice.
Disclaimer: This is research-only, informational analysis and not investment advice. It may include AI-generated interpretation and general industry context. Always verify important details using primary sources.
Comments