
Bank of Marin Bancorp's Shift From Profit to Loss Highlights Operational Challenges
The bank’s pronounced net income decline in 2025 contrasts with strong liquidity and capital buffers amid concentrated regional commercial real estate exposure.
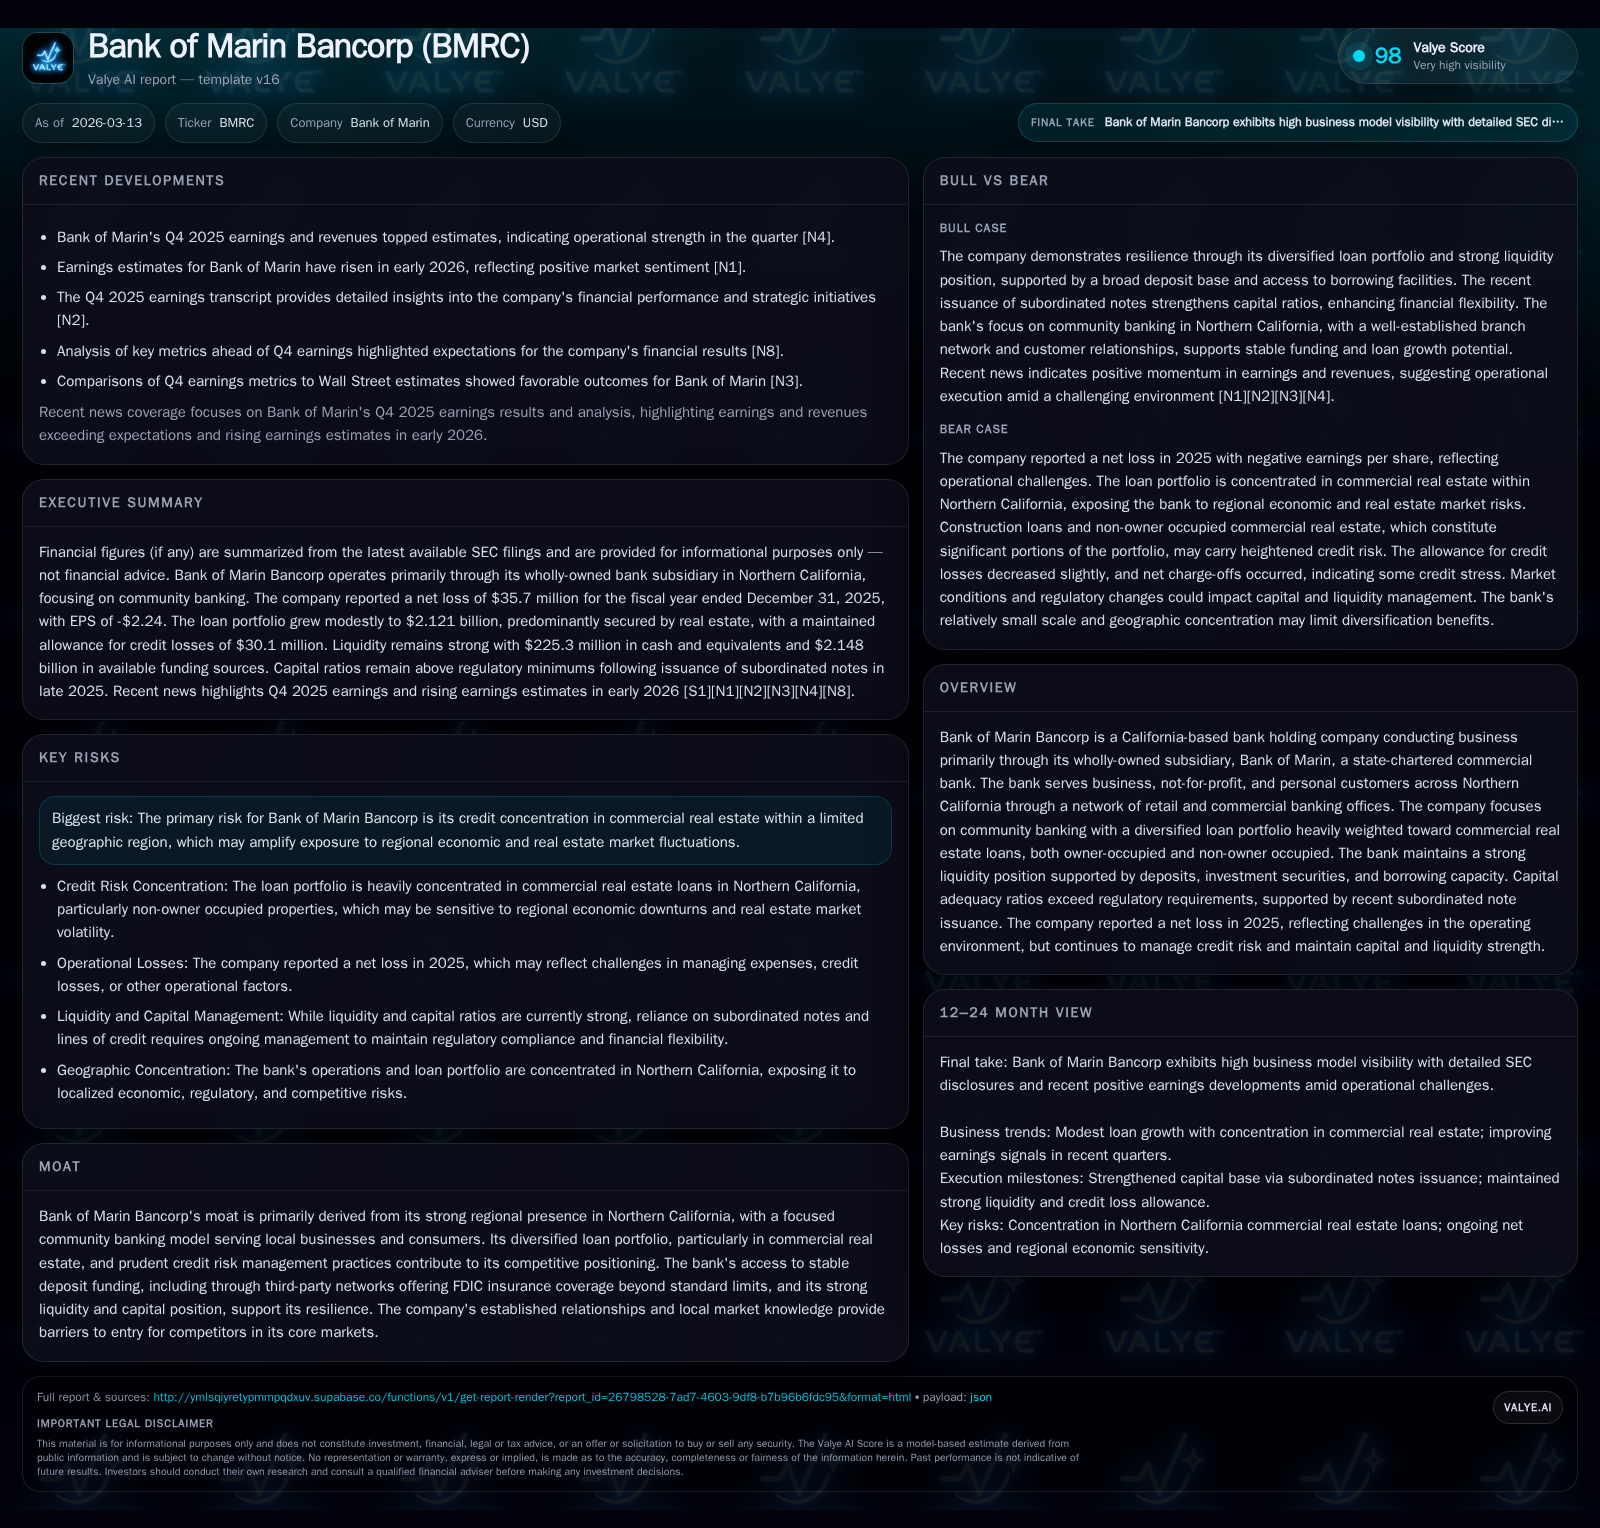
Bank of Marin Bancorp, a Northern California community bank with a commercial real estate-heavy loan portfolio, reported a drastic swing from solid profitability in prior years to a significant net loss in 2025. Despite operational earnings pressures and credit provisioning challenges primarily linked to its geographic and loan concentration, the bank maintains robust capital adequacy ratios supported by subordinated note issuance and strong liquidity sourced from deposits and secured borrowing lines. Shareholder returns persist through steady dividends and measured buybacks, while future performance will hinge on managing credit risk within the shifting regional real estate market.
2025 Financial Performance: From Gains to Losses
Bank of Marin Bancorp experienced a sharp reversal in financial results over the last two years after posting solid profitability earlier. Net income declined from $46.6 million in 2022 and $19.9 million in 2023 to losses of $8.4 million in 2024 and a pronounced $35.7 million loss for 2025 [F1]. This represents an approximate -324% year-over-year change between 2024 and 2025 [F1]. Despite the negative net income, operating cash flow increased nearly 38% year-over-year to $39.1 million in 2025 [F1], signaling resilient core cash generation amid earnings pressures.
Capital expenditures rose to $1.8 million in 2025 from $0.52 million the prior year [F1], suggesting investments possibly aimed at future operational enhancements.
The decline in net income reflects increased provisioning for credit losses alongside realized investment securities losses as detailed in SEC filings [S1][S6]. Non-interest expenses including provisions for credit losses rose notably compared to prior years [S6].
Historical performance (annual)
| FY | Net ($mm) | CFO ($mm) | Capex ($mm) | Net YoY |
|---|---|---|---|---|
| 2025 | -36 | 39 | 2 | -324.2% |
| 2024 | -8 | 28 | 1 | -142.3% |
| 2023 | 20 | 36 | 2 | -57.3% |
| 2022 | 47 | 55 | 2 |
Source: SEC companyfacts cache [F1].
Capital returns and efficiency (annual)
| FY | Div ($mm) | FCF ($mm) | ROE% |
|---|---|---|---|
| 2025 | 16 | 37 | -9.0 |
| 2024 | 16 | 28 | -1.9 |
| 2023 | 16 | 34 | 4.5 |
| 2022 | 16 | 53 | 11.3 |
Source: SEC companyfacts cache [F1].
Note: Operating Cash Flow (OpCF) and Dividends Paid are based on reported figures.
Loan Portfolio Trends and Credit Risk Management
Bank of Marin's loan portfolio remained heavily concentrated in commercial real estate (CRE), comprising approximately 79% of total loans as of December 31, 2025 [S19][S23]. Total loans increased modestly by about $38 million (1.8%) to roughly $2.12 billion due primarily to a $92.7 million rise in commercial non-owner occupied CRE loans [S19][S23]. This growth was partly offset by declines of $32.6 million in other residential loans and $21.9 million in construction loans.
Allowance for credit losses remained stable near $30 million at year-end reflecting ongoing cautious management amid economic uncertainties affecting the regional CRE market concentrated in Northern California counties such as Marin, Sonoma, San Francisco, Alameda, Napa, Sacramento, and Contra Costa [S19][S6]. The bank applies standard industry methods including borrower cash flow analysis, collateral valuation assessments, internal risk grading aligned with FDIC definitions, and focused reviews on construction and CRE sectors vulnerable to cyclical downturns [S25][S26].
Organic loan originations increased sharply to approximately $273.5 million from $152.6 million the previous year while payoffs accelerated to nearly $146 million indicating active portfolio turnover aimed at maintaining credit quality and adapting lending strategy [S23].
Loan maturities extend beyond one year with significant portions due after five years; interest rate sensitivity is managed through fixed versus variable rate structures complemented by interest rate swap hedging initiated since mid-2023 [S16][S20].
Capitalization and Liquidity Position
Despite net losses eroding equity—declining from around $435 million at end-2024 to about $395 million at end-2025—Bank of Marin sustained strong capital ratios above regulatory thresholds supported by issuance of $45 million Fixed-to-Floating Subordinated Notes maturing December 2035 during Q4 2025 plus an internal capital infusion of $30 million into the Bank subsidiary [F1][S7][S11][S14]. At year-end, Total Capital Ratio was near 14%, Common Equity Tier 1 around 13%, and Tier 1 Leverage Ratio approximately 8.5%, all comfortably exceeding well-capitalized standards [S8].
Liquidity was robust with available funding sources totaling roughly $2.15 billion at December 31, 2025—equivalent to about 63% of total deposits—including unrestricted cash ($206 million), unencumbered securities ($490 million), plus undrawn secured borrowing lines from Federal Home Loan Bank ($967 million), Federal Reserve Discount Window ($345 million), and correspondent banks ($140 million) [S4][S5]. No short-term borrowings were outstanding during the period reflecting confidence in deposit stability.
Deposits slightly increased to approximately $3.32 billion supported by diversified retail and commercial customer bases alongside third-party FDIC-insured deposit products accessed via Promontory Interfinancial Network programs such as CDARS, ICS, and DDM that extend insurance coverage beyond standard limits enhancing funding stability [S10][S1].
Management employs sophisticated liquidity risk management practices including daily monitoring, contingency funding plans with stress testing similar to larger banks’ liquidity coverage ratio frameworks ensuring preparedness against market disruptions [S12].
Regional Market Concentration: Strengths and Risks
Bank of Marin’s franchise centers on Northern California markets characterized by high-value real estate but also cyclical vulnerabilities especially within office/non-owner occupied CRE segments affected by post-pandemic structural shifts such as remote work trends impacting demand particularly in San Francisco properties which represent roughly ~3-4% of the loan book exposure [S22][S6].
The concentration (~79% CRE) creates systemic risk tied closely to localized economic conditions but also provides competitive moat advantages through deep local relationships and expertise difficult for competitors lacking comparable presence or knowledge to replicate.
This geographic focus necessitates vigilant risk monitoring given susceptibility to interest rate fluctuations affecting borrower repayment capacity and collateral valuations within these core counties (Marin, Sonoma etc.) where most lending occurs [S22].
Shareholder Returns: Dividends Steady Amid Earnings Volatility
Despite net income losses through late-2025, Bank of Marin maintained consistent shareholder returns with dividends paid at a stable rate of $1 per common share annually totaling approximately $16.1 million during the year reflecting prudent cash deployment constrained by California regulatory dividend limitations tied primarily to retained earnings or excess assets post-distribution [F1][S7].
Share repurchases resumed under a new Board-approved authorization permitting up to $25 million buybacks effective July 24, 2025 through July 31, 2027 replacing an expired program; approximately $3.3 million was repurchased during fiscal 2025 at an average price near $21.93 per share reflecting measured capital allocation balancing shareholder value with preservation amid earnings pressure [F1][S7].
Outlook and Key Considerations
Recent analyst commentary indicates rising earnings estimates for Bank of Marin heading into early 2026 potentially reflecting expected stabilization or easing of credit stresses alongside anticipated benefits from capital strengthening initiatives like subordinated note proceeds deployment and expanded loan origination targeting lower-risk profiles [N1].
However, material risks persist due to high concentration exposure requiring close attention to:
- Loan charge-off trends signaling asset quality changes;
- Deposit retention dynamics particularly uninsured balances;
- Adjustments in allowance for credit losses aligned with evolving market conditions;
- Movements in capital ratios post-dividend/share repurchase activities;
- Execution effectiveness on diversifying loan origination pipelines beyond stressed segments.
Management’s ability to adapt strategies within its entrenched community banking model will be critical for navigating sector cyclicality versus leveraging franchise strengths.
This report integrates publicly disclosed regulatory filings with contextual analysis without offering investment recommendations regarding Bank of Marin Bancorp securities or assets.
Disclaimer: This is research-only, informational analysis and not investment advice. It may include AI-generated interpretation and general industry context. Always verify important details using primary sources.
Comments