
Bob's Discount Furniture's Robust Revenue Gain and Strategic Capital Moves Post-IPO
Fiscal 2025 marked a pivotal year for Bob's Discount Furniture, with strong organic growth and an IPO-fueled capital restructuring laying groundwork for future expansion.
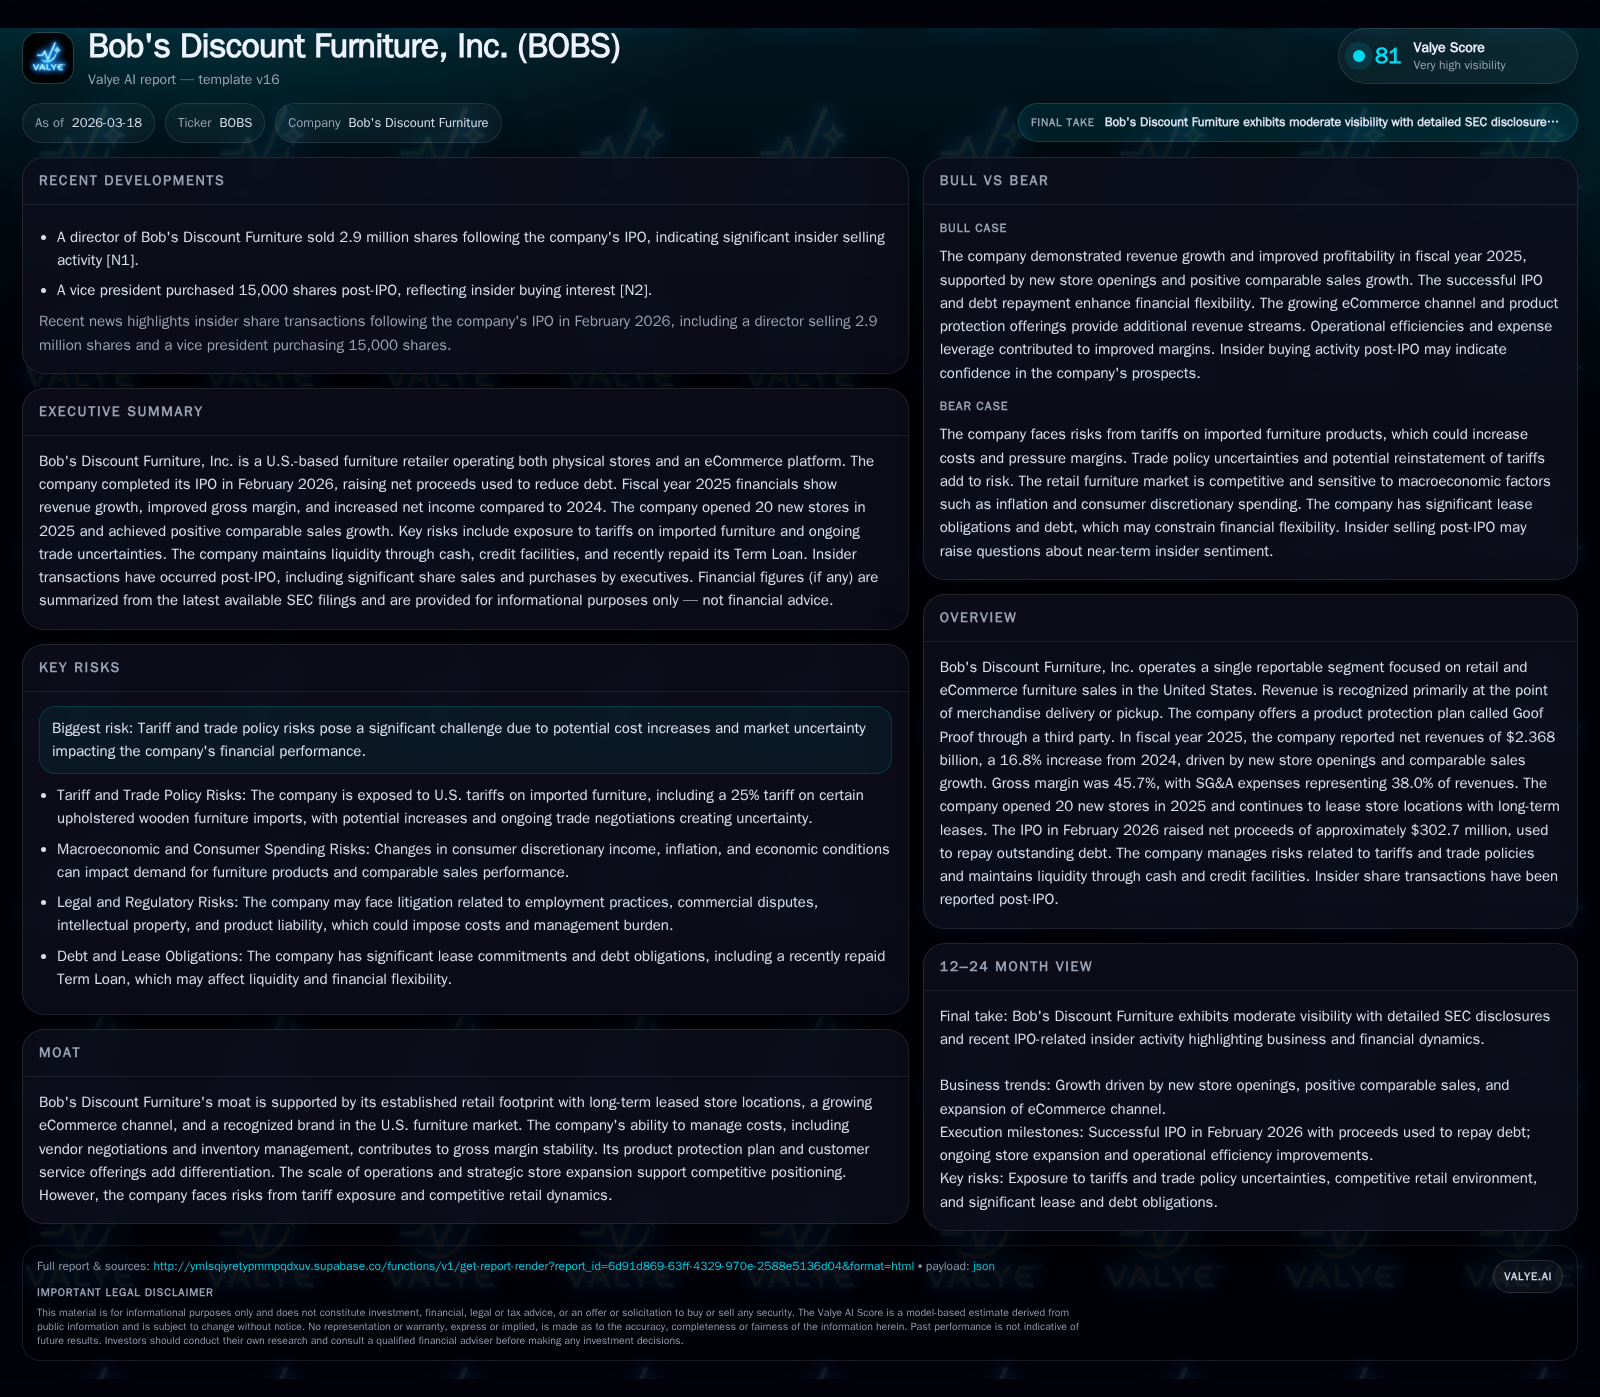
In fiscal 2025, Bob's Discount Furniture posted a 16.8% revenue increase to $2.368 billion driven by new store openings and solid comparable sales gains, while successfully leveraging operational efficiencies. Concurrently, the company's February 2026 IPO raised $302.7 million in net proceeds utilized primarily to prepay substantial term loan debt, significantly de-leveraging the balance sheet. Despite headwinds from fluctuating tariffs on imported furniture goods, Bob's maintained gross margin resilience through vendor collaboration and pricing strategies. Looking ahead, ongoing store expansion, enhanced eCommerce penetration, and vigilant tariff management remain key growth levers amidst competitive retail dynamics.
Fiscal 2025 Performance: Growth Amid Operational Leverage
Bob's Discount Furniture registered marked top-line momentum in fiscal year 2025 with net revenues reaching $2.368 billion, a substantial advance of 16.8% compared with the previous year reflecting both incremental store openings and stronger same-store sales performance [F1][S1]. The company expanded its physical presence by opening twenty new stores while simultaneously generating a comparable sales uplift of 7.7%, driven chiefly by higher retail channel conversion rates and revitalized customer traffic through its growing eCommerce platform.
Gross profit rose by approximately $132.9 million (14%) contributing to a gross margin of 45.7%, slightly below the prior year's 46.8%, affected by shifts towards lower-margin product categories categorized as the “Good” product mix alongside elevated freight costs following normalization after earlier supply chain disruptions [S14]. However, this margin pressure was mitigated by proactive vendor negotiations and strategic pricing measures accommodating tariff impacts.
On the expense front, SG&A scaled up due to investments linked to new store payroll costs and occupancy rises but demonstrated expense leverage as SG&A consumed a reduced share of revenue—38% versus 40.1% in fiscal 2024—reflecting operational scale efficiencies [F1][S1]. Pre-opening expenses increased marginally associated not only with retail outlets but for a regional distribution center slated to fully operate in early 2026, underscoring capacity expansion efforts [S14].
Below operating income line, net income climbed to approximately $121.7 million supported by enhanced topline performance alongside controlled interest expense given recent refinancing activities (discussed later) [F1].
| FY | Net Rev ($B) | OpInc ($M) | Net Inc ($M) | CFO ($M) | Capex ($M) | Rev YoY % | Net YoY % |
|---|---|---|---|---|---|---|---|
| 2023 | 2.008 | NA | NA | NA | NA | ||
| 2024 | 2.028 | NA | ~87.9 | ~161 | ~78 | +1.0% | +12.6% |
| 2025 | 2.368 | NA | ~121.7 | ~164 | ~56 | +16.8% | +38.6% |
Note: Operating income not explicitly disclosed; CFO represents net cash from operating activities; Capex primarily related to store openings and infrastructure.
Expanding Retail Footprint and Enhancing eCommerce Channel
Bob’s continued aggressive store expansion strategy unlocked additional revenue streams through twenty new locations added during fiscal 2025—outpacing prior years—anchored primarily on long-term leased sites enhancing cost predictability over time [F1][S1]. This broadening footprint allowed the company to tap new regional markets while layering omni-channel engagement via its digital "Omnicart" platform facilitating seamless transitions between online browsing and physical purchases.
Retail channel conversions accelerated notably alongside gross traffic improvements reflecting effectiveness of localized marketing programs and store layouts optimizing shopper experience metrics—a key driver underpinning the positive comparable sales trend [S1]. In parallel, the eCommerce business gained traction with its share climbing from around 14.1% in fiscal 2024 to approximately 15.5% in fiscal 2025 reflecting consumer preference shifts reinforced by the digitally refreshed website and order fulfillment improvements [F1][S14]. This dual-channel approach created synergies allowing dynamic inventory allocation across regions enhancing delivery lead times and reducing logistics costs.
Tariff Exposure: Navigating an Uncertain Trade Environment
The company confronted notable risks stemming from tariff impositions enacted during early-to-mid fiscal year 2025 when U.S customs levied duties ranging between 25-30% on specific imported wooden upholstered furniture segments predominantly sourced internationally [S1][S13]. These tariffs escalated input costs but were partially moderated via vendor concessions evident within cost structures and selective price adjustments implemented across regional markets aiming for tariff pass-through without erosion of customer demand.
Legal dynamics introduced complexity when the U.S Supreme Court invalidated several such tariffs citing statutory overreach in February 2026; nevertheless pending administrative actions foreshadow reinstatements under alternative legal frameworks injecting volatility into procurement planning horizons [S22]. To maintain margin steadiness, Bob’s employed diversified sourcing tactics including shifting suppliers where feasible while calibrating pricing programs to reflect external cost headwinds prudently.
Capital Structure Evolution: IPO Proceeds Used to Shrink Debt Burden
February 2026 underscored a transformational capital event as Bob's Discount Furniture completed its IPO issuing approximately 19.45 million shares priced at $17 per share culminating in gross proceeds near $330 million and net proceeds around $302.7 million after underwriting fees and offer expenses [S4]. These proceeds were decisively applied toward prepaying most of the company's existing Term Loan facility initiated just months earlier at $350 million bearing interest at SOFR plus fixed spreads.[S5][S6]
By March 12, post additional cash availability and revolver borrowings, the entire Term Loan obligation was fully extinguished substantially de-leveraging the balance sheet which previously bore significant fixed charge burdens limiting financial flexibility [S12]. The company had no drawn borrowings against its $125 million revolving credit facility at year-end though full access remains intact furnishing liquidity cushions valued at about $177 million inclusive of cash holdings [$53 million] for near-term needs.
Interest expense dropped noticeably post-repayment freeing resources for reinvestment initiatives or discretionary returns policies going forward.[S18] Debt amortization costs related to issuance fees were accelerated but deemed non-recurring.
Capital Allocation Priorities: Balancing Dividends, Buybacks, and Growth Investment
During late October calendar year-end cycle (Q4 fiscal), the Board authorized an extraordinary dividend payout at $2.45 per share amounting roughly to $423 million payable before public listing completion underscoring commitment to return capital to legacy shareholders before transitioning capital structure post-IPO[S4][S7]. Accompanying this distribution was compensatory option exercise price adjustments ensuring equitable treatment across incentive holders tied to Management Incentive Plans.
To date following listing, no share repurchase program has been initiated focusing resources on organic growth initiatives including projected capital expenditure budget target between $110-$115 million for fiscal year 2026 normalizing higher investments in new facilities plus supply chain upgrades such as regional distribution centers planned for deployment early next year.[F1][S14]
KPI Analysis: Comparable Sales, Gross Margin, SG&A Leverage
The reported comparable sales growth rate of +7.7% marks a marked recovery relative to prior years’ declines exacerbated by macroeconomic headwinds including inflationary pressures impacting consumer spending patterns which benchmarked industry electron furniture trends negatively[S1]. Gross margin resilience despite modest contraction amid freight cost normalization highlights successful inventory management strategies balancing product mix shifts favoring value-oriented “Good” categories with rising transportation expenses absorbed through refined pricing/pricing elasticity.[S14]
Less SG&A intensity percentage confirms efficient scale capture operating leverage effects along payroll discipline despite few incrementals linked to store expansion strategy validating expense architecture robustness.[F1]
Forward Outlook: New Store Openings, Pricing Strategy, and Operating Risks
Analyst perspective emphasizes watching how Bob’s sustains momentum beyond the initial accelerated growth phase particularly regarding:
- The cadence and productivity of additional store openings aligned with geographic saturation metrics,
- Effectiveness of tariff pass-through mechanisms should import duties reemerge,
- Response calibration amid intensified competition by mass-market retailers deploying omnichannel sales models,
- Further penetration gains within eCommerce driven by innovations like Goof Proof warranty protection plan differentiating customer service value proposition[N1][N2][S1]. Channel diversification will likely remain critical as comprehensive consumer journeys intertwine online/offline touchpoints deeper.
Evaluating Financial Health: Cash Flows, Liquidity, and Return on Equity
Cash flow generation remained stable with operating cash flow reported near $164 million against moderate capex outflows approximating $56 million preserving solid free cash flow dynamics proving sufficient coverage for strategic dividends or debt repayments [F1] [S16]. Liquidity buffers totaling approximately $177 million inclusive of unused revolving credit materially mitigate near-term funding risk profiles while working capital exhibits disciplined management balancing inventory replenishment consistent with sales volumes.[S12][S21]
ROE metrics are not explicitly disclosed in current filings limiting quantitative return on equity assessment evaluation.
This analysis is grounded solely on reported data from Bob's Discount Furniture's SEC filings and pertinent news sources as cited; it does not include investment recommendations nor speculative forecasts beyond company guidance where explicitly noted.
Disclaimer: This is research-only, informational analysis and not investment advice. It may include AI-generated interpretation and general industry context. Always verify important details using primary sources.
Comments