
CBIZ, Inc.’s Strategic Acquisition Engine Powers Exceptional Income Growth
CBIZ’s disciplined acquisition strategy, coupled with its multi-practice model and strong human capital focus, has driven a dramatic surge in income despite modest revenue growth.
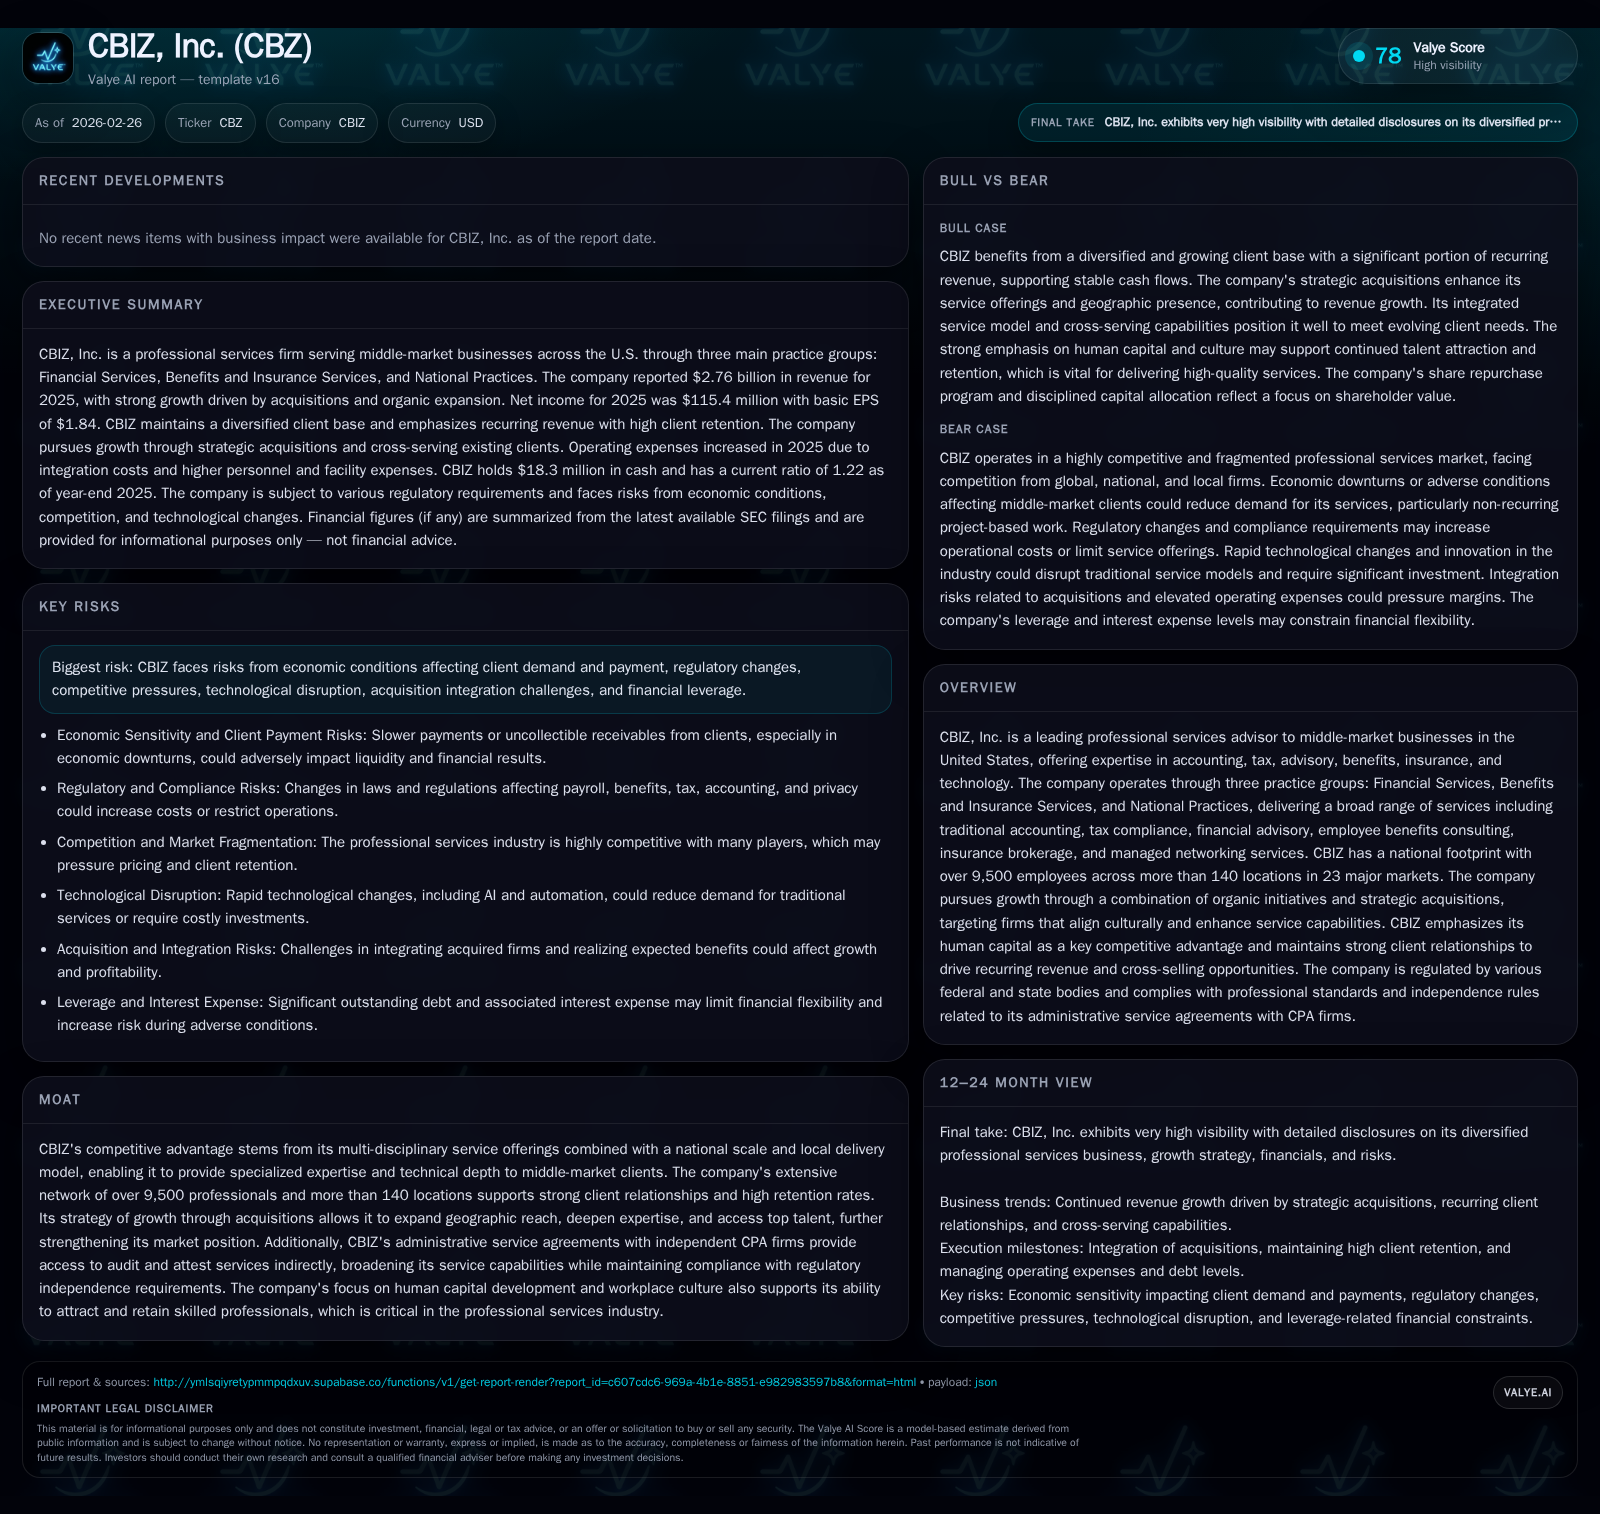
CBIZ, Inc. experienced a remarkable leap in operating and net income in fiscal 2025, largely propelled by strategic acquisitions that augmented its Financial Services and complementary practice groups. The company’s broad national footprint across more than 140 locations supports its multidisciplinary approach to serving middle-market clients, while its significant debt load from recent financing arrangements imposes constraints on capital allocation. Going forward, CBIZ’s growth will hinge on balancing organic initiatives with selective acquisitions, managing integration and regulatory risks, and leveraging its extensive talent base.
Historical Revenue and Earnings Trajectory: The Acquisition-Fueled Growth Surge
CBIZ posted a striking financial turnaround in fiscal 2025 with operating income reaching approximately $234 million—a jump of over 217% compared to $73.7 million in the prior year—and net income growing by roughly 181% to about $115 million from $41 million in 2024 [F1]. This surge came despite relatively flat overall revenue growth of around 2%, highlighting the outsized impact of strategic acquisitions. Quarterly disclosures confirm that revenue growth of nearly $863 million over the first nine months of 2025 was predominantly acquisition-driven, contributing roughly 62% of incremental revenue during that period [S2].
Operating cash flow also expanded robustly by about 56% year-over-year to nearly $193 million in FY2025 supporting both growth investments and shareholder returns while capital expenditures rose modestly by around 31% to $17 million as part of scalability initiatives [F1].
Historical performance (annual)
| FY | Net ($mm) | CFO ($mm) | OpInc ($mm) | Capex ($mm) | Net YoY |
|---|---|---|---|---|---|
| 2025 | 115 | 192 | 234 | 17 | +181.3% |
| 2024 | 41 | 124 | 74 | 13 | -66.1% |
| 2023 | 121 | 154 | 165 | 23 | +14.8% |
| 2022 | 105 | 126 | 168 | 9 |
Source: SEC companyfacts cache [F1].
Capital returns and efficiency (annual)
| FY | Buybacks ($mm) | FCF ($mm) | ROE% |
|---|---|---|---|
| 2025 | 160 | 176 | 6.6 |
| 2024 | 0 | 111 | 2.3 |
| 2023 | 65 | 130 | 15.3 |
| 2022 | 123 | 117 | 14.8 |
Source: SEC companyfacts cache [F1].
Note: Operating income and net income dropped sharply in FY2024 due to acquisition-related costs before rebounding strongly in FY2025.
Service Group Contributions and Geographic Footprint Expansion
CBIZ’s business is segmented into three key practice groups—Financial Services (accounting, advisory, tax), Benefits & Insurance Services (employee benefits consulting, insurance brokerage), and National Practices (technology services including managed networking). In fiscal year 2025, Financial Services dominated revenue generation at over 83%, increasing its share from roughly 75% the previous year; Benefits & Insurance contributed nearly 15%, while National Practices accounted for a smaller portion at about 1.7% [S8].
The company’s expansive platform encompasses over 9,500 professionals spanning more than 140 offices across 23 major U.S. markets coast-to-coast, allowing CBIZ to combine national scale with localized service delivery essential for midmarket clients requiring specialized expertise with a personal touch [S1], [S8]. This network enables technical depth necessary for compliance-intensive areas such as tax consulting and financial advisory.
An important dimension is the administrative service alliances maintained with independent CPA firms which provide indirect audit and attest services without impairing regulatory independence—a nuanced compliance safeguard underscored by state accountancy laws restricting direct audit practice by affiliated entities within non-audit providers like CBIZ [S1].
Balancing Organic Initiatives Against Acquisition-Driven Growth
While acquisitions constitute the primary growth engine—with significant revenue increments tied to integrations completed mostly in late-2024 through 2025—the company also pursues organic initiatives focusing on cross-selling existing clients and developing new service lines aligned with technological innovation such as cybersecurity and cloud infrastructure advisory [S1], [N2].
However, current macroeconomic uncertainty has introduced softness particularly evident within project-based offerings where demand fluctuates due to geopolitical tensions and budget caution among middle-market clients—dampening visibility into near-term organic growth trajectories [N2], [S2]. Management commentary underlines a pipeline that remains active yet carefully calibrated against elevated debt levels.
Capital Structure Dynamics: Managing Debt Amid Ambitious Expansion
As of December 31, 2025, CBIZ carried approximately $1.47 billion of principal outstanding under its Amended and Restated Credit Agreement (“2024 Credit Facilities”) which consists of a $1.4 billion term loan plus revolving credit capacity totaling $600 million; availability under credit commitments stood around $316-$370 million mid-year approaching year-end per disclosures [S4], [S9], [S24].
These facilities carry covenants restricting leverage ratios and interest coverage which have been met thus far but constrain aggressive capital deployment including share repurchases or dividends beyond defined thresholds.
Floating rates expose interest expense to monetary policy volatility—a growing headwind as rates have trended upward since originating the facility—increasing the financial burden related to servicing this debt amid an uncertain economic cycle and placing premium importance on operating cash flow management for maintaining acquisition flexibility and debt compliance simultaneously [S10], [S11].
Capital Allocation Priorities: Share Repurchases, Debt Reduction, and Acquisitions
CBIZ demonstrates disciplined capital stewardship balancing debt repayment against shareholder returns and strategic acquisitions. In fiscal year 2025 CBIZ repurchased shares totaling about $160 million after going idle on buybacks during fiscal year 2024—evidencing renewed confidence partially fueled by improved cash generation as CFO expanded by more than half year-on-year to nearly $193 million allowed greater discretionary funding after operational requirements are met [F1], [S6], [S29].
The company maintains that acquisitions remain central to growth strategy but tempered by prudent deleveraging to preserve future strategic optionality; repayment priorities alongside contingent earnouts linked to past deals also absorb significant cash resources.
Risks from Market Cyclicality, Regulatory Changes, and Integration Challenges
Several risk vectors could materially disrupt CBIZ’s trajectory:
- Economic downturns could curtail client demand for higher-margin nonrecurring project services impacting revenues disproportionately given fixed cost structures limiting quick expense deflation [S21],
- Legislative/regulatory shifts—particularly relating to insurance brokerage commissions or tax/accounting regulations—may compress margins or require service model adaptation (e.g., audit independence preventing direct attest offerings necessitating affiliate arrangements) [S14],[S18],[S20],
- Integration risk accompanies every acquisition with potential dilution of culture or operational disruption amid complex compliance requirements governing payroll/benefits data handling especially amidst cybersecurity threats; prior third-party breaches underscore persistent vulnerability despite mitigating controls [S18],[S20],
- Elevated leverage increases vulnerability to interest rate hikes or covenant breaches possibly triggering accelerated repayments that would constrain operational freedom if not carefully managed [S10],[S13].
The slight softness reported recently in project-based business suggests monitoring economic indicators closely remains paramount for anticipatory planning [N2].
Forward-Looking Indicators and Milestones to Monitor
Absent formal forward guidance beyond cautionary notes embedded within quarterly filings and Deutsche Bank’s recent initiation covering CBIZ with a 'Hold' rating emphasizing valuation versus macro uncertainties[N3], key metrics warrant close observation:
- Organic revenue trends especially within high-growth specialty areas like cybersecurity consulting or cloud migration services,
- Integration success metrics post-acquisition including retention rates among acquired personnel,
- Adjusted leverage ratios reflecting ongoing debt reduction progress against covenant targets,
- Human capital development outcomes measured through attrition rates versus award recognitions,
- Operational cash flow stability amidst potential economic headwinds. These signals will clarify whether CBIZ can sustain the momentum derived principally from acquisitions while expanding organically amidst evolving market demands.
The Human Capital Advantage: Retention, Culture, and Talent Acquisition
CBIZ identifies its workforce as the cornerstone competitive moat underpinning client relationships essential in delivering complex multi-disciplinary solutions requiring substantial technical expertise. As of fiscal year-end they employed over 9,500 professionals nationally supported by continuous investment in culture nurturing evidenced by receipt of more than 120 workplace awards through diverse forums during calendar year 2025 alone exemplifying industry recognition for talent management excellence[S1]. Such accolades translate into lower turnover risks which enhances deep client engagement facilitating effective cross-selling across their integrated services platform—an attribute vital for sustaining midmarket advisory leadership given elevated competition for top-tier professional talent.
This analysis synthesizes disclosed financial data alongside qualitative disclosures from SEC filings and recent market commentary but refrains from projecting financial forecasts absent explicit company-issued guidance. Readers should consider emergent economic conditions impacting client activity along with operational execution risks inherent within highly leveraged professional services models.
Disclaimer: This report is prepared solely for informational purposes based on publicly available data as of February 26, 2026; it does not constitute investment advice or recommendations regarding securities transactions.
Disclaimer: This is research-only, informational analysis and not investment advice. It may include AI-generated interpretation and general industry context. Always verify important details using primary sources.

Comments