
Comstock Holding Companies: Anchoring Growth with a Fee-Based Model in Transit-Oriented Real Estate
Comstock leverages its asset-light, vertically integrated platform centered on its Anchor Portfolio to structure consistent, fee-based revenues within the Washington D.C. metro’s evolving transit corridors.
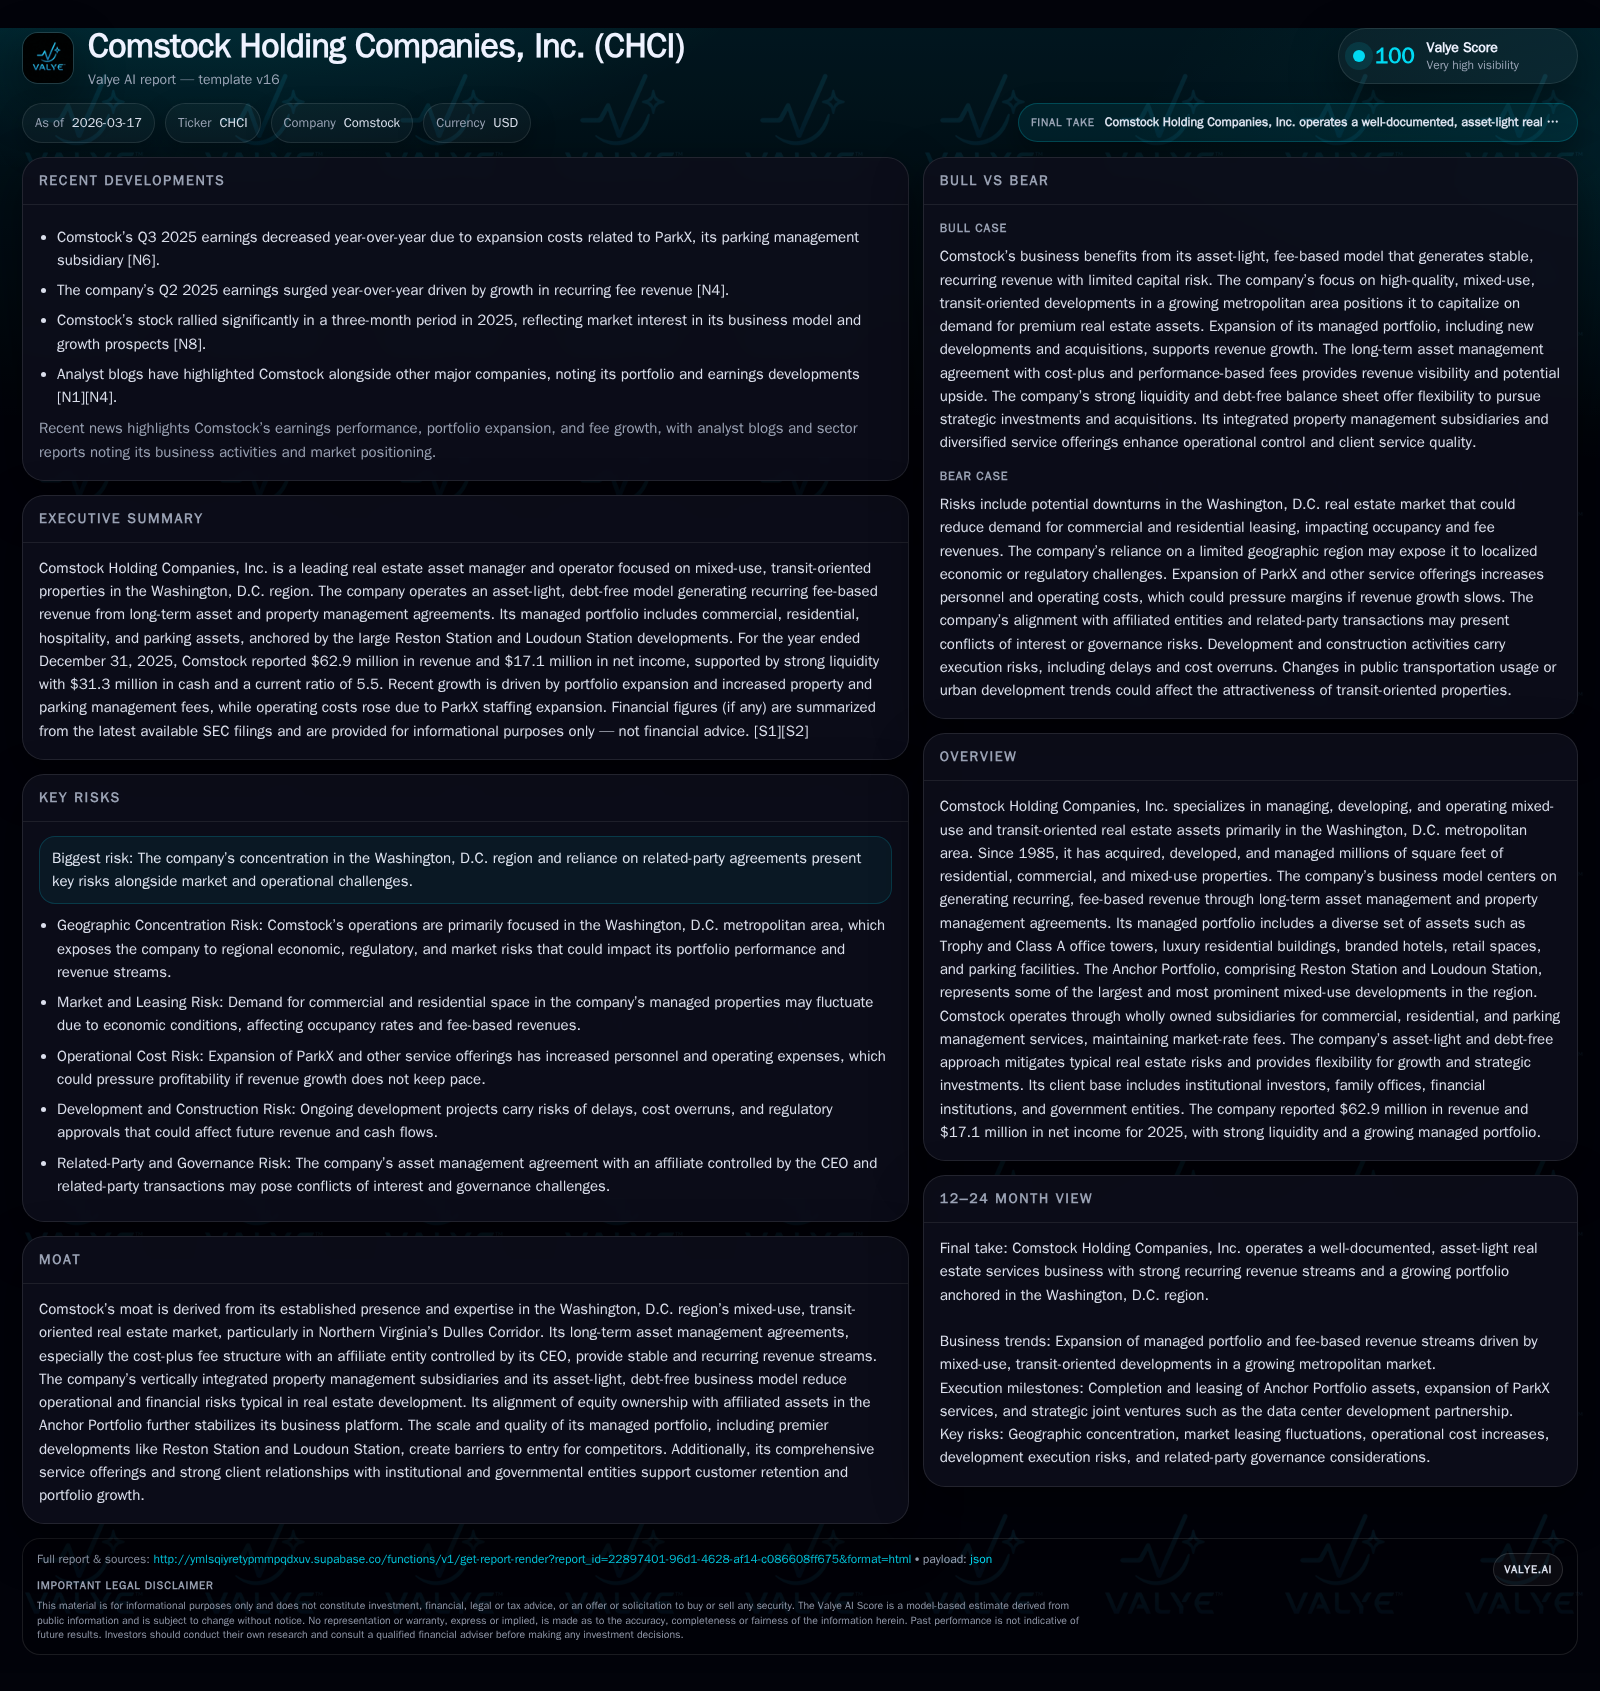
Comstock Holding Companies, Inc. has built a distinctive niche specializing in mixed-use, transit-oriented developments primarily in Northern Virginia's Dulles Corridor. Its long-standing asset management agreements—particularly the cost-plus arrangement with a CEO-affiliated entity—underpin a recurring and stable fee revenue model that mitigates typical real estate risks. Historical financials reveal double-digit growth in operating and net income driven by portfolio expansion and operational efficiencies, though operating cash flow experienced volatility aligned with investment activities and working capital shifts. With no debt and liquid assets exceeding $31 million, Comstock maintains a conservative balance sheet supporting strategic growth via organic diversification and third-party contracts while facing concentration risks linked to regional focus and related-party dependencies.
Building on Decades of Transit-Oriented Development Success
Founded in 1985, Comstock Holding Companies has evolved into a specialized real estate services player focusing on high-quality mixed-use developments intricately connected to transit infrastructure within the Washington D.C. metropolitan area. Central to its identity is the expertise cultivated in Northern Virginia's Dulles Corridor — a region transformed by Metro’s Silver Line extension linking key employment hubs including Reston, Tysons Corner, Loudoun County, and access to Dulles International Airport [S1][S2][F1].
Comstock’s flagship Anchor Portfolio comprises marquee projects such as Reston Station and Loudoun Station which blend Trophy and Class A office towers with luxury residential units, branded hospitality offerings including condominium hotels, retail spaces, public plazas, and significant parking provisions. Their scale not only cements regional prominence but erects entry barriers through established public-private partnerships with institutional investors and governmental bodies [S1][S2]. The portfolio anchors the firm's recurring revenue streams via long-term contracts which drive resilient performance even amid cyclical real estate market shifts.
Current Portfolio Composition and Leasing Dynamics in the D.C. Metro Area
As of December 31, 2025, Comstock manages a diversified portfolio consisting of:
- 15 commercial properties totaling approximately 2.6 million sqft of space with an average stabilized lease rate of about 93%;
- 7 residential assets accounting for some two million sqft across more than 1,700 high-end units;
- Hospitality operations involving over 290,000 sqft with 248 keys;
- Extensive parking facilities managed under their ParkX subsidiary encompassing roughly 26,000 spaces across 34 garages alongside additional security and operational services equating to around 8,000 service hours weekly [S1][S2].
This composition illustrates a balanced exposure across asset types that capitalize on transit accessibility while providing multiple layers of ancillary income. The leasing dynamics for commercial spaces reflect stability given new Trophy-class developments delivered as recently as late-2024 within The Row at Reston Station. Residential luxury condos including JW Marriott Residences also complement cash flow consistency [S1].
Long-Term Asset Management Agreements: Frameworks Driving Recurring Revenue
Comstock’s core business model revolves around fee-based income driven by long-term asset management contracts.
A pivotal relationship is the cost-plus fee structure agreement with Comstock Partners LC — an affiliate controlled by CEO Christopher Clemente — covering all properties within the Anchor Portfolio (2022 AMA) [S1][S2]. Under this framework, management fees consist of baseline cost reimbursement plus an agreed-upon margin which ensures stable revenue inflows typically less volatile than market leases or transactional development profits.
For non-Anchor assets under third-party ownership or joint ventures, Comstock employs market-rate fee structures negotiated individually but generally based on property-level cash receipts or square footage managed.
Further distinguishing Comstock is its fully vertically integrated property management capability through three wholly owned subsidiaries: CHCI Commercial (office properties), CHCI Residential (multi-family assets), and ParkX Management (parking-related services). This integration enhances control over service delivery quality while enhancing margins absent the markup typical in outsourced property management vendors [S1][S2].
Financial Performance Trends: Double-Digit Operating Income and Net Income Growth
Over recent years ending December 31, fiscal data indicate strong financial momentum:
Historical performance (annual)
| FY | Net ($mm) | CFO ($mm) | OpInc ($mm) | Net YoY |
|---|---|---|---|---|
| 2025 | 17 | 5 | 12 | +17.1% |
| 2024 | 15 | 11 | 10 | +87.1% |
| 2023 | 8 | 9 | +5.9% | |
| 2022 | 7 | 8 |
Source: SEC companyfacts cache [F1].
Capital returns and efficiency (annual)
| FY | ROE% |
|---|---|
| 2025 | 24.4 |
| 2024 | 27.8 |
| 2023 | 20.9 |
| 2022 | 25.5 |
Source: SEC companyfacts cache [F1].
The steady double-digit growth rates stem from both expansion of its managed portfolio — driven by new developments like Trophy-class office towers — alongside operating efficiencies within its multi-segment property management subsidiaries [F1]. Supplemental fee income from leasing activity also contributed meaningfully to improved Adjusted EBITDA margins reported internally [S6].
Cash Flow Variability Versus Capital Allocation Priorities
Despite profitability gains at the income statement level, operating cash flow demonstrated notable variability:
- FY2025 CFO registered at approximately $4.8 million compared with $10.7 million in FY2024, indicating a -55.1% year-over-year decline.
- This drop was largely attributed to temporary working capital shifts especially lower collections on related party receivables and ramp-up payroll expenses within ParkX as it scaled new janitorial/porter services [S4][S14].
- Simultaneously capex increased by about +48%, partially reflecting investment into multifamily acquisitions being pursued via joint venture models including a pending Rockville acquisition expected Q1-2026 [S19].
Nonetheless, Comstock maintains disciplined liquidity risk management underpinned by over $31 million in cash & equivalents combined with an unused $10 million credit facility provided by CP as of year-end — underscoring financial flexibility amidst operational reinvestment cycles [F1][S5][S6].
Strategic Expansion Potential and Regional Market Concentration Risks
Growth drivers include opportunities to extend third-party asset management scope beyond anchor assets to broaden recurring revenue bases organically or through acquisitions. At the same time:
- Geographic concentration remains high within Greater Washington D.C., specifically Northern Virginia’s Dulles Corridor where economic conditions or policy changes could materially impact demand.
- Heavy reliance on related-party agreements (affiliate controlled by CEO) reflects operational alignment but also creates disclosure sensitivities regarding governance or pricing practices [S1][S29].
Balancing these factors requires maintaining competitive differentiation via service quality ("We Show Up" ethos), portfolio diversity across asset classes, and exploring synergistic ventures such as new data center campus development partnerships recently announced (e.g., Jericho Energy joint venture) focused outside traditional geographies but leveraging sector expertise [N1][S16].
Detailed Review of Capital Structure and Balance Sheet Strength
Comstock’s conservative financial posture sets it apart from many real estate peers characterized by heavier leverage profiles:
- Cash & cash equivalents stood at $31.3 million at December ’25 end,
- Current assets totaled $53.3 million against current liabilities of approximately $9.7 million yielding a strong current ratio near ~5.5,
- The Company carries no outstanding drawn debt despite maintaining access to a revolving credit line,
- Limited capex reflects restrained physical asset ownership emphasizing asset-light management earnings rather than capital-intensive development risk exposure [F1][S14][S15].
This liquidity buffer supports both organic growth trajectories and opportunistic acquisitions without compromising financial flexibility or requiring external capital markets access presently.
ROE and Shareholder Returns: Evaluating Dividend Policy in Context
By combining net income generation with accrued shareholders’ equity rising to about $70 million (~$69.97M) as of year-end ’25 results in an approximate annualized ROE of ~24.4%. This return underscores efficient deployment of capital centered mainly on scalable fee-based services rather than direct property ownership risks common within real estate sectors [F1][S11].
Historically:
- No dividends have been declared or paid out,
- Share repurchases are negligible with last meaningful purchases dated several years prior,
- Stock-based compensation expense rose modestly matching scaling employee headcount but not materially dilutive considering earnings growth trajectory [S13][F1].
Therefore shareholder value appears prioritized through retained earnings fueling growth initiatives instead of distributions following typical real estate development firm profile.
Outlook: What to Watch in Comstock’s Upcoming Milestones and Growth Initiatives
Looking forward key indicators include:
- Progression on potential multifamily properties acquisition in Rockville expected early ’26 closing alongside formation of joint venture partners,
- Expansion plans for ParkX subsidiary encompassing new remote monitoring capabilities and extended janitorial services tailored for urban mixed-use complexes,
- Deepening third-party client relationships for asset/property management contracts external to Anchor Portfolio,
- Execution details around the Jericho Energy Ventures collaboration targeting AI data center campuses leveraging natural gas-powered infrastructure represent diversification beyond transit-oriented cores but consistent with strategic urban-industrial real estate trends [N1][S3][S19].
Analysts should monitor incremental fee revenue recognition disclosures tied to these expansions along with any evolving regulatory scrutiny concerning related party transactions or geographic concentration effects inherent within the business model.
Disclaimer: This analysis is based exclusively on publicly available company filings dated up to March 17, 2026 ([F1], [S#]) and recent news reports ([N#]). It does not constitute investment advice or recommendations but aims to provide an objective financial perspective rooted in disclosed information.
Disclaimer: This is research-only, informational analysis and not investment advice. It may include AI-generated interpretation and general industry context. Always verify important details using primary sources.
Comments