
Revenue Contraction and Capital Strategy in CHS INC's Latest Fiscal Cycle
CHS INC experienced a significant top-line decline alongside shrinking profitability, while maintaining liquidity and continuing preferred dividends amid strategic capital decisions.
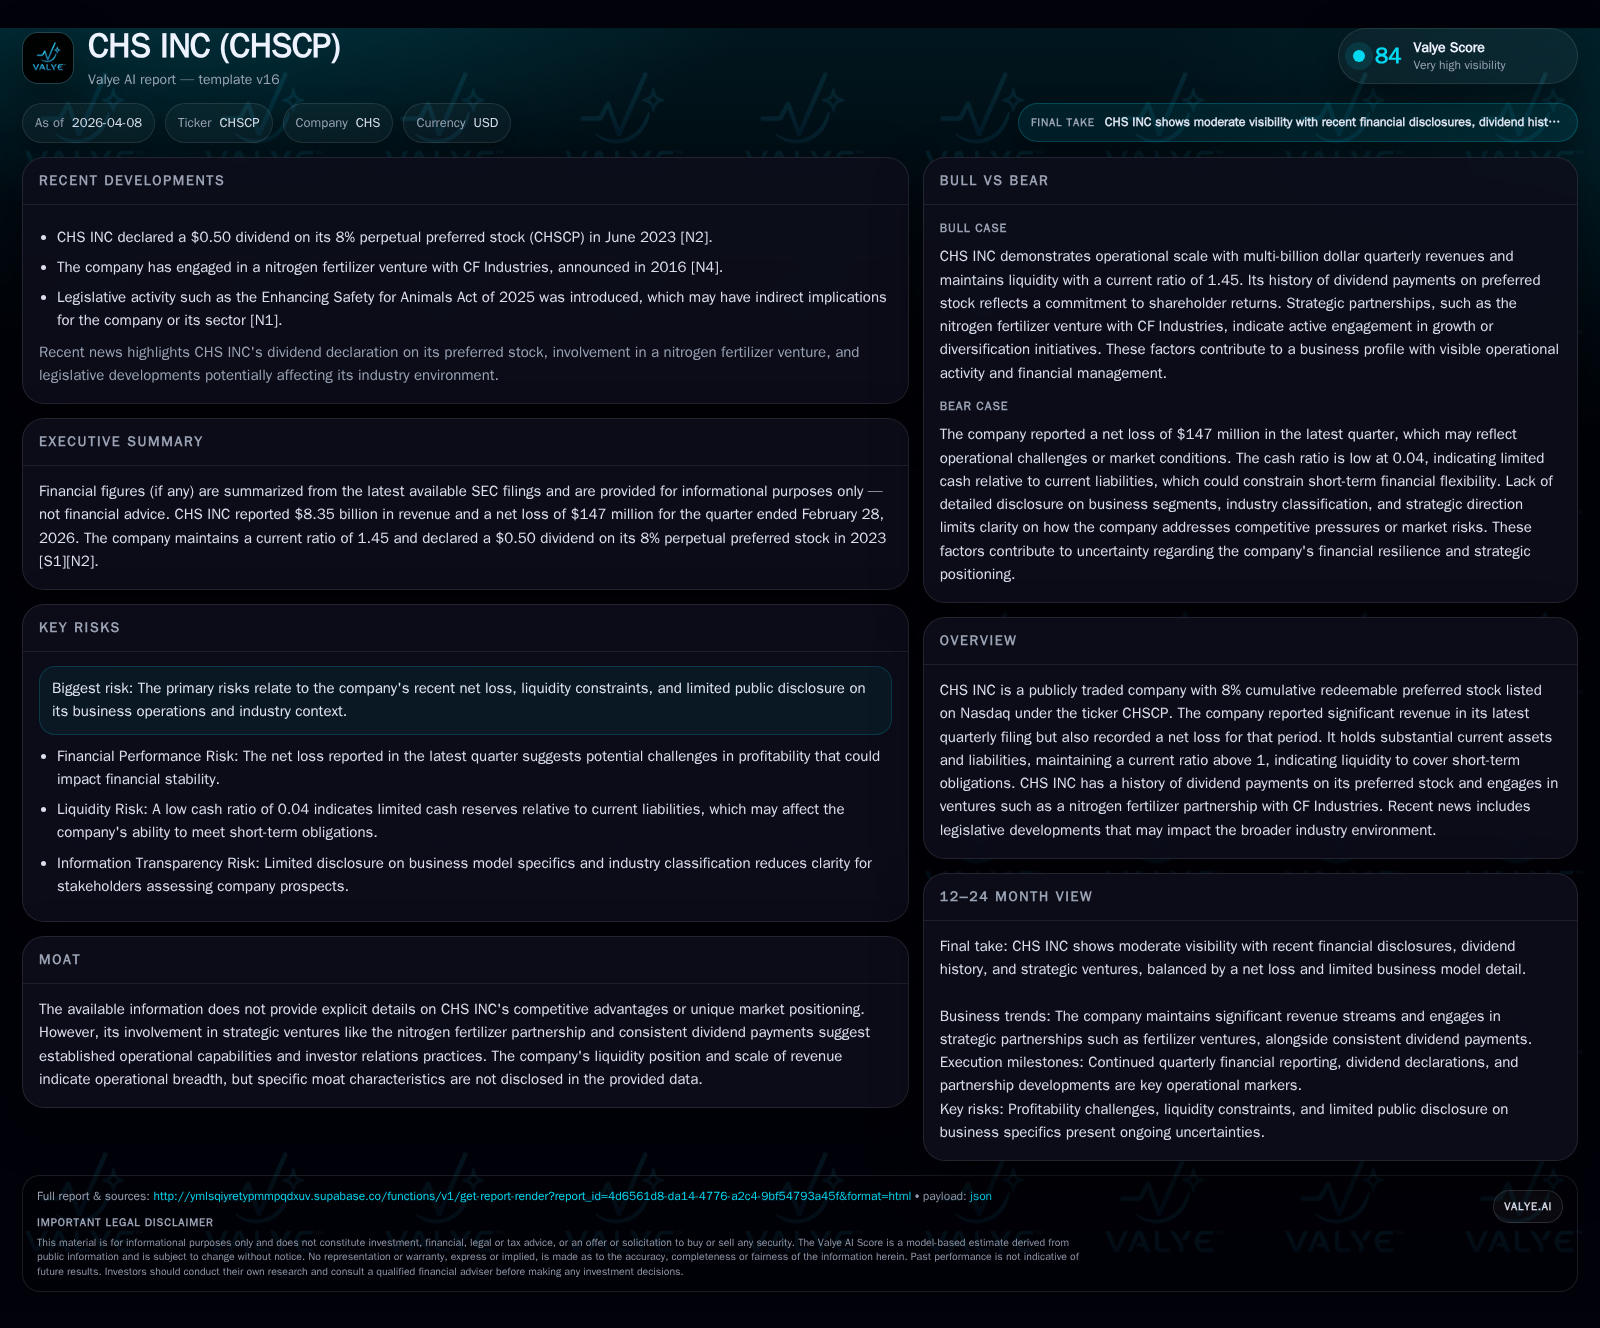
CHS INC's fiscal year 2025 revealed a nearly 10% decline in revenue, accompanied by an 84.5% drop in operating income and falling net income compared to the prior year. Despite these financial headwinds, the company preserved a strong liquidity position with a current ratio of approximately 1.45 and sustained dividends on its cumulative redeemable preferred stock. Capital expenditures moderated slightly, reflecting a cautious investment posture amid reduced free cash flow. The operating cash flow halved year-over-year, resulting in negative free cash flow for FY2025. Management’s disclosure highlights risks tied to regulatory and litigation exposures as well as limited public guidance on growth prospects beyond ongoing fertilizer ventures and legislative factors.
Historical Financial Fluctuations: Revenue and Earnings Retreat
Over the past four fiscal years, CHS INC has exhibited a marked decline in revenue beginning from an all-time high of about $47.79 billion in FY2022 down to approximately $35.46 billion in FY2025—a contraction of nearly 25%. The most recent fiscal year (ending August 31, 2025) alone saw a 9.7% decrease from the prior year’s revenue level of $39.26 billion [F1]. This top-line shrinkage has correlated with significant erosion in profitability metrics: operating income tumbled by an alarming 84.5% year-over-year to just over $90 million from roughly $584 million in FY2024, while net income declined by approximately 45.8% to $598 million [F1]. Such dynamics reflect acute pressure on margins that have outpaced the top-line decline.
Historical performance (annual)
| FY | Rev ($bn) | Net ($mm) | CFO ($bn) | OpInc ($mm) | Rev YoY | Net YoY |
|---|---|---|---|---|---|---|
| 2025 | 35.5 | 598 | 0.6 | 91 | -9.7% | -45.8% |
| 2024 | 39.3 | 1102 | 1.3 | 584 | -13.9% | -42.0% |
| 2023 | 45.6 | 1900 | 3.3 | 1344 | -4.6% | +13.2% |
| 2022 | 47.8 | 1679 | 1.9 | 1129 |
Source: SEC companyfacts cache [F1].
Capital returns and efficiency (annual)
| FY | FCF ($bn) | ROE% |
|---|---|---|
| 2025 | -0.1 | 5.4 |
| 2024 | 0.5 | 10.2 |
| 2023 | 2.7 | 18.2 |
| 2022 | 1.6 | 17.8 |
Source: SEC companyfacts cache [F1].
Operating Income Slump: Decoding the Margin Compression
CHS INC’s extraordinary drop in operating income—from over half a billion dollars down to just above ninety million—represents a severe compression of operating margins to roughly a quarter of last year's level relative to revenue [F1]. Such deterioration may reflect adverse operational leverage effects where fixed costs remain elevated despite revenue declines or downward pressure from increased cost inputs not fully offset by pricing power.
While specific segment details are unavailable here, this magnitude of EBITDA margin pressure signals challenges either in production efficiency, commodity pricing dynamics, or margin squeeze possibly related to supply chain or regulatory cost inflation common within agribusiness and related sectors.
Liquidity Profile: Assessing Short-Term Financial Health
Despite profitability setbacks, CHS INC maintains solid liquidity buffers: as of February 28, 2026, current assets total approximately $10.26 billion versus current liabilities near $7.08 billion — yielding a current ratio around 1.45 [F1]. Cash and equivalents stand at about $248 million, underscoring available near-term liquidity supportive of working capital requirements [F1].
Recent SEC disclosures reaffirm careful monitoring of financing capacity amidst softening cash flows [S6][S7][S11][S20][S21]. This relatively healthy working capital position positions CHS favorably to manage short-term obligations and operational funding needs even as earnings falter.
Exploring Capital Allocation: Dividends, Share Buybacks, and Investments
CHS INC continues to honor dividends on its suite of cumulative redeemable preferred stock series consistently through early-2026 filings [S8][S9][S10][S15][S16][S17][S18][S19][S25]. Dividend rates remain steady across classes—e.g., the standard preferred stock retains an $0.50 quarterly dividend—reflecting firm commitment to shareholder distributions within the preferred tier.
Conversely, the company recorded negative free cash flow for FY2025 estimated at nearly -$92.8 million after capex spending of about $729 million—a near-10% reduction relative to FY2024 yet notably higher than earlier years [F1]. This suggests cautious restraint on capital expenditures mindful of cash flow contraction.
There is no evidence of recent share buybacks; capital allocation appears focused on sustaining dividend payments and prudent investment amid operating pressures.
Growth Aspirations and Market Constraints: Insight from Recent Disclosures
Management disclosures within risk sections note involvement in strategic ventures such as nitrogen fertilizer partnerships with CF Industries but offer limited explicit guidance tying these efforts directly to near-term growth milestones [N# missing; S4][S5]. Regulatory developments potentially affecting the broader industry environment are acknowledged but not elaborated upon.
The absence of targeted growth forecasts indicates conservatism given the volatile earnings environment; any expansion likely depends on context-specific market dynamics influenced by commodity cycles and regulatory outcomes.
Risks Spotlight: Legal, Regulatory, and Operational Challenges
SEC filings identify legal risks including ongoing litigation exposure and regulatory compliance complexities that could affect operating performance or capital requirements [S4][S5]. The company flags liquidity constraints linked with profit volatility though currently mitigated by its asset base.
Such risks must be considered ongoing factors shaping baseline operational uncertainty within CHS’s sectoral framework.
Forward-Looking Considerations: Milestones to Monitor
No direct guidance is offered for future quarters or fiscal years [N# absent; S2][S3]. Analysts monitoring CHS should prioritize tracking quarterly liquidity fluctuations versus debt levels, dividend declarations for preferred stock classes for signs of stress or continuity, and any commentary on margin recovery strategies or capex modifications issued through upcoming quarterly reports.
Key indicators will include stabilization or improvement of operating income margin, restoration of positive free cash flow, and progress updates on fertilizer joint ventures under evolving agricultural market conditions.
Equity and Return Metrics: ROE Amidst Profit Volatility
With equity capital reaching roughly $11.08 billion as of FY2025 end and net income at about $598 million during that period, CHS posts an approximate return on equity near 5.4% [F1]. This moderate ROE underscores subdued profitability vis-à-vis invested equity base surrounding volatile earnings trends.
Given negative free cash flow metrics alongside halved operating cash flows compared with prior year [F1], enhancing capital efficiency remains a critical challenge for management going forward.
This analysis strictly relies on audited financial statements and official SEC filings without extrapolation beyond documented facts or speculative projections about CHS INC’s operational strategy or market conditions. The reader should consider this report informational rather than advisory regarding investment decisions.
Disclaimer: This is research-only, informational analysis and not investment advice. It may include AI-generated interpretation and general industry context. Always verify important details using primary sources.
Comments