
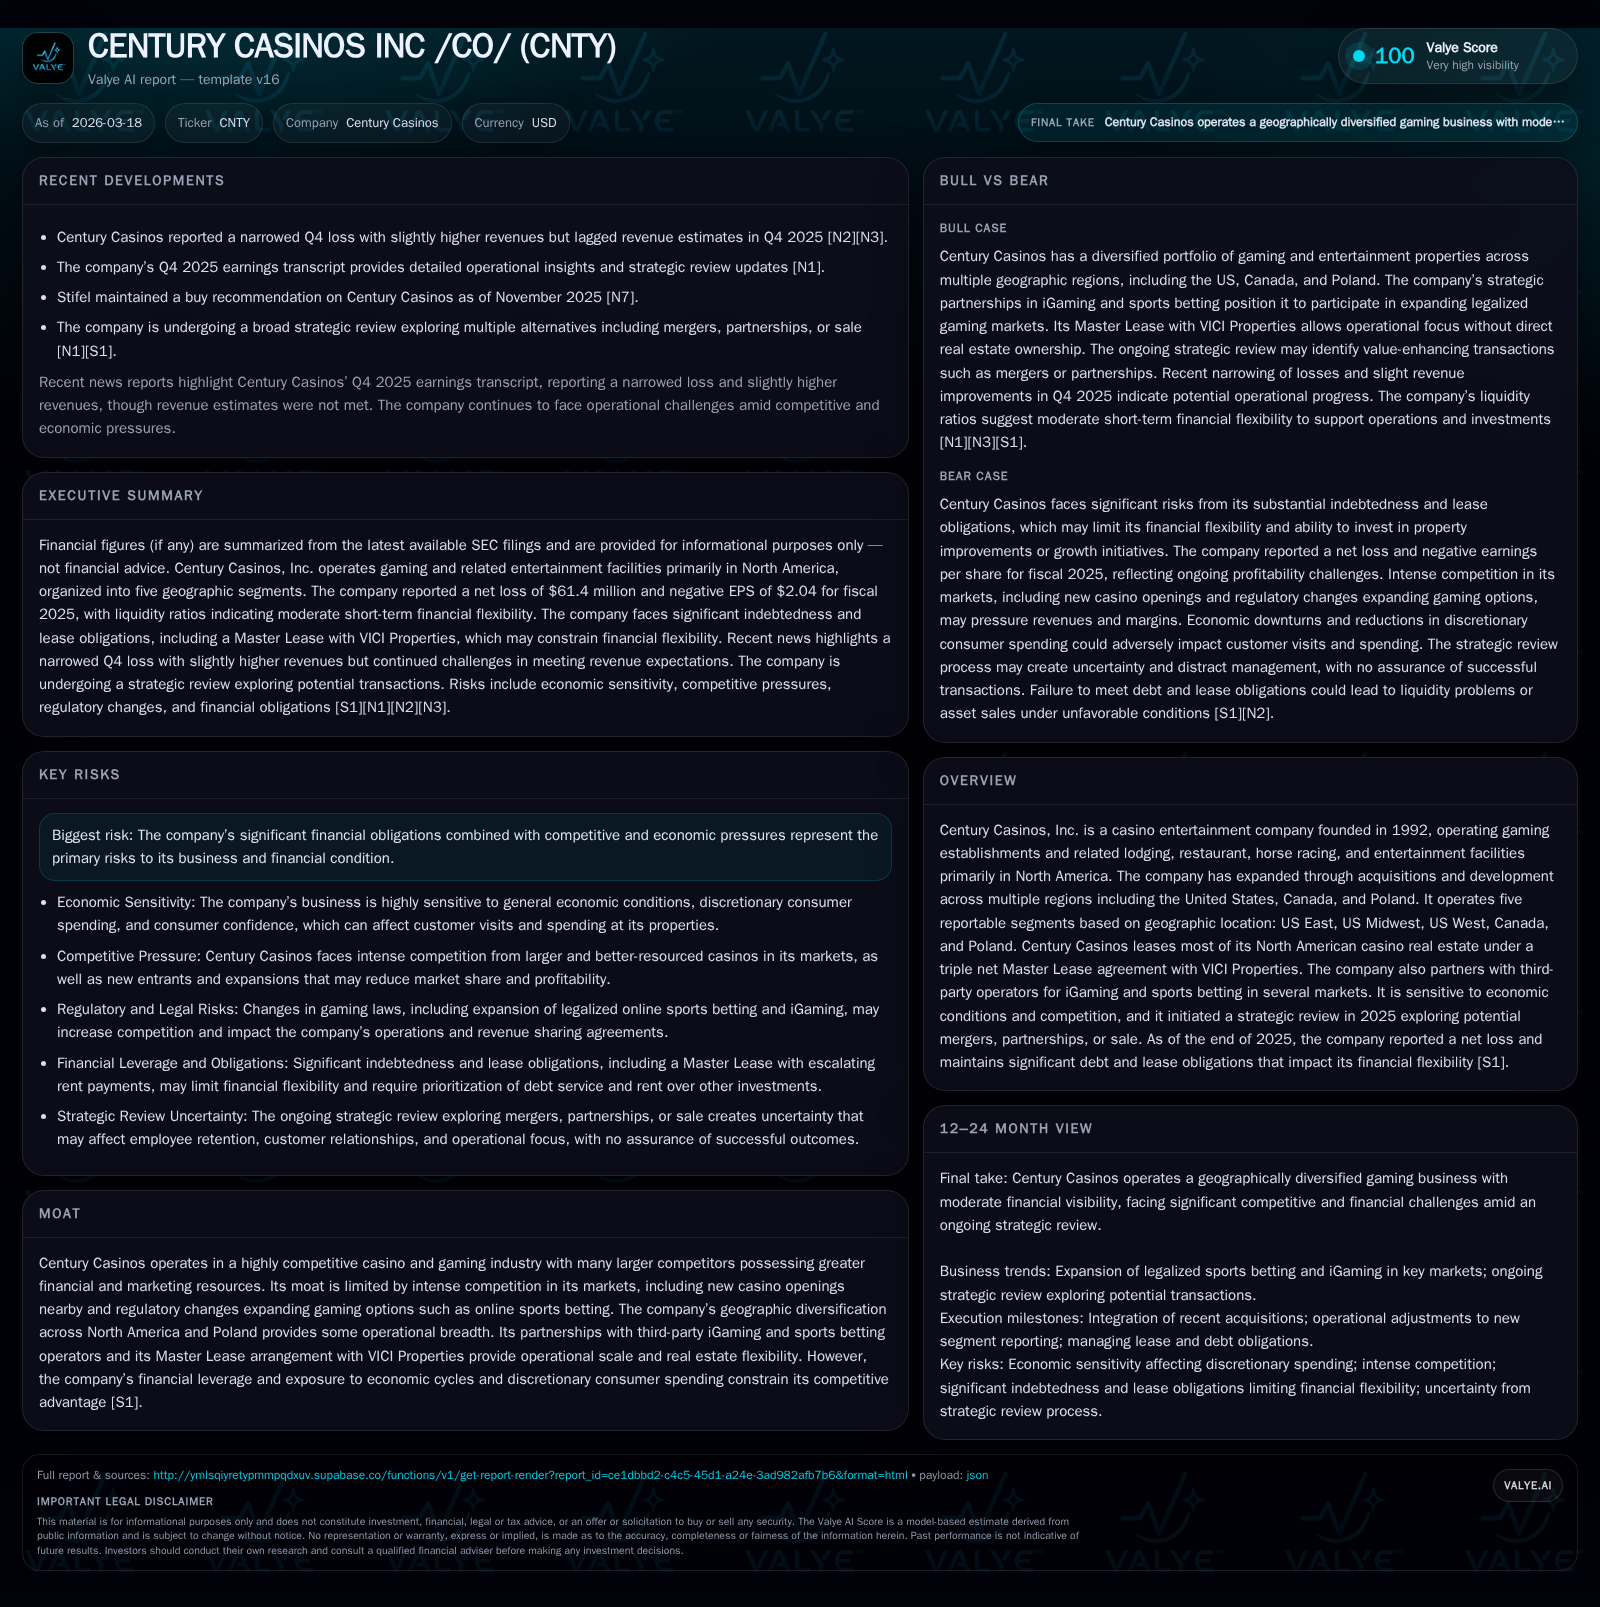
Century Casinos' Earnings Recovery and Debt Strain Highlight Strategic Tradeoffs
Despite revenue growth and operating income rebound in 2025, Century Casinos faces ongoing net losses and negative equity amid substantial debt and lease obligations.
Century Casinos posted a significant operating income recovery to $51.3 million in 2025 from a loss in 2024, driven by geographic diversification and operational restructuring. However, the firm continues to report a large net loss of $61.4 million and faces negative shareholder equity primarily due to high leverage and escalating lease obligations to VICI Properties. Liquidity remains constrained with free cash flow turning negative after heavy capital expenditures, while strategic alternatives including potential mergers are under review.
Overview and Historical Performance
Century Casinos Inc., founded in 1992, operates casinos along with related lodging, restaurant, horse racing, and entertainment facilities primarily in North America and Poland [S1]. The company expanded through acquisitions including key purchases from 2019 onwards (Missouri, West Virginia casinos), development projects in Canada, and a majority ownership stake in Casinos Poland Ltd resulting from incremental investments since 2007 [S1].
The firm's revenues have demonstrated a steady rebound following severe declines related to the COVID-19 pandemic's impact on discretionary consumer spending. Revenue grew from $67.2 million in FY2019 to $84.8 million in FY2020 before jumping to $388.5 million in FY2021 and reaching $430.5 million by FY2022 [F1]. Although more recent revenue figures are not explicitly available beyond FY2022, this trend reflects recovery momentum.
Operating income has shown volatility: after achieving $67.6 million in FY2022, the company registered a loss of $22.2 million in FY2024 before rebounding strongly to $51.3 million in FY2025 [F1]. Net income followed a similar pattern with positive earnings of approximately $8 million in FY2022 shifting to significant losses of -$153.6 million in FY2024 and improving to -$61.4 million by FY2025 [F1].
Historical performance (annual)
| FY | Net ($mm) | CFO ($mm) | OpInc ($mm) | Capex ($mm) | Net YoY |
|---|---|---|---|---|---|
| 2025 | -61 | 7 | 51 | 22 | +60.0% |
| 2024 | -154 | -3 | -22 | 59 | -444.7% |
| 2023 | -28 | 24 | 64 | 60 | -453.5% |
| 2022 | 8 | 37 | 68 | 19 |
Source: SEC companyfacts cache [F1].
Capital returns and efficiency (annual)
| FY | FCF ($mm) | ROE% |
|---|---|---|
| 2025 | -15 | 62.9 |
| 2024 | -63 | 442.3 |
| 2023 | -36 | -23.2 |
| 2022 | 18 | 5.5 |
Source: SEC companyfacts cache [F1].
Revenue Drivers and Operational Segmentation
Century's revenue is geographically diversified across five reportable segments as of late-2025: United States East, Midwest, West, Canada, and Poland [S1]. This segmentation aims to provide greater transparency on regional performance amid varied competitive environments.
Growth has been supported by acquisitions such as the Nugget Casino Resort operations and Rocky Gap Casino Resort & Golf acquired between late-2019 and early-2020s [S1]. The company leases most real estate properties under a triple net Master Lease agreement with VICI Properties Inc., facilitating an asset-light model but imposing significant fixed lease costs [S1].
Complementary revenues derive from ancillary services like hotel operations, restaurants, entertainment shows, off-track betting at racing centers (RECs), sports betting partnerships through third parties (legal iGaming), and player club programs—common levers for expanding spend per visitor beyond gaming wagers [S1][N1][N6].
Financial and Capital Structure Analysis
As of September 30, 2025, Century Casinos reported total long-term debt of approximately $338.7 million comprising primarily a Goldman Sachs Term Loan of about $334 million with an average interest rate exceeding 10%, alongside credit facilities for Polish entities ($4 million) and UniCredit term loans ($0.39 million) [S6][S11][S17].
This capital structure is further leveraged by operating lease obligations under the Master Lease with VICI Properties totaling roughly $715.7 million at year-end [S16]. Scheduled rent payments for 2026 are estimated at approximately $67.3 million subject to Consumer Price Index escalations annually [S16].
Liquidity indicators show current assets around $104 million against current liabilities near $79.8 million yielding a current ratio close to 1.3x—a moderate cushion that requires prudent management given fixed lease commitments [F1]. Cash and equivalents totaled about $68.9 million at fiscal year-end providing working capital flexibility but underscoring tight liquidity conditions.
Capital expenditures declined significantly from nearly $59 million in FY24 to approximately $22 million in FY25 indicating moderation following prior heavy investments linked to new property integrations such as the Nugget acquisition [F1]. Operating cash flow improved to just under $7 million during FY25 after previous negative outflows [F1], yet free cash flow remained negative by over $15 million as investment needs outpaced cash generation excluding lease payments—a notable stress point for financial flexibility [F1][N1][N6].
Equity turned negative at -$97.7 million by December 31, 2025 compared with positive equity pre-pandemic years reflecting accumulated losses and goodwill impairments associated with acquisitions [F1].
Recent Operating Results
Q4-2025 results released March 13th showed narrowing losses alongside slightly higher revenues relative to prior quarters; however earnings still lagged some market expectations [N1][N2][N6]. The persistent net loss despite operating profit underscores high interest expenses from significant debt as a major profitability constraint.
Management is actively evaluating strategic alternatives including potential mergers or sales aimed at reducing leverage pressures while enhancing competitive positioning amid intensifying market competition especially from online gaming expansions by rivals [S25][N1].
Industry Positioning and Risks
Century operates amid intense competition from larger casino operators with deeper financial resources and expanding online gaming platforms eroding traditional foot traffic [S1][S20]. Local market saturation poses challenges given overlapping demographic pools targeted by multiple casinos.
Economic cyclicality influences discretionary spending critical for casino visitation; inflationary pressures coupled with tariffs affecting input costs may compress margins further [S20]. Regulatory complexity spans multi-jurisdictional licenses requiring stringent compliance alongside emerging cybersecurity risks tied to increasing AI usage internally and externally warrant careful monitoring [S20][S21][S24].
Capital Allocation Strategy
Share repurchases resumed modestly with about $4 million bought back during FY25 after years without buybacks noted historically—signaling selective shareholder return deployment when feasible despite challenging financial conditions; dividend payments remain undisclosed indicating restraint under current leverage stress [F1][S22].
High interest expense obligations dominate resource allocation given effective cost of debt exceeding double digits; this constrains flexibility for dividends or aggressive reinvestment while maintaining essential capital expenditure levels for competitiveness.
Summary Remarks
Century Casinos has regained operational profitability post-pandemic through strategic acquisitions across North America and Poland combined with segment reorganization geared toward localized management oversight. Nonetheless, significant financial leverage driven by acquisition financing plus substantial fixed real estate lease burdens elevate risk amid stiffening competition from larger integrated gaming operators. Liquidity challenges persist balancing reinvestment needs against debt servicing while exploring strategic alternatives aimed at stabilizing its deteriorated equity base. Investors should closely monitor upcoming quarterly cash flow trends and developments regarding strategic alternatives that could materially affect business fundamentals.
This analysis relies exclusively on publicly available data through March 18th, 2026 without forward-looking forecasts or investment advice.
Disclaimer: This is research-only, informational analysis and not investment advice. It may include AI-generated interpretation and general industry context. Always verify important details using primary sources.
Comments