
CSB Bancorp’s Strategic Earnings Rebound and Regional Banking Outlook
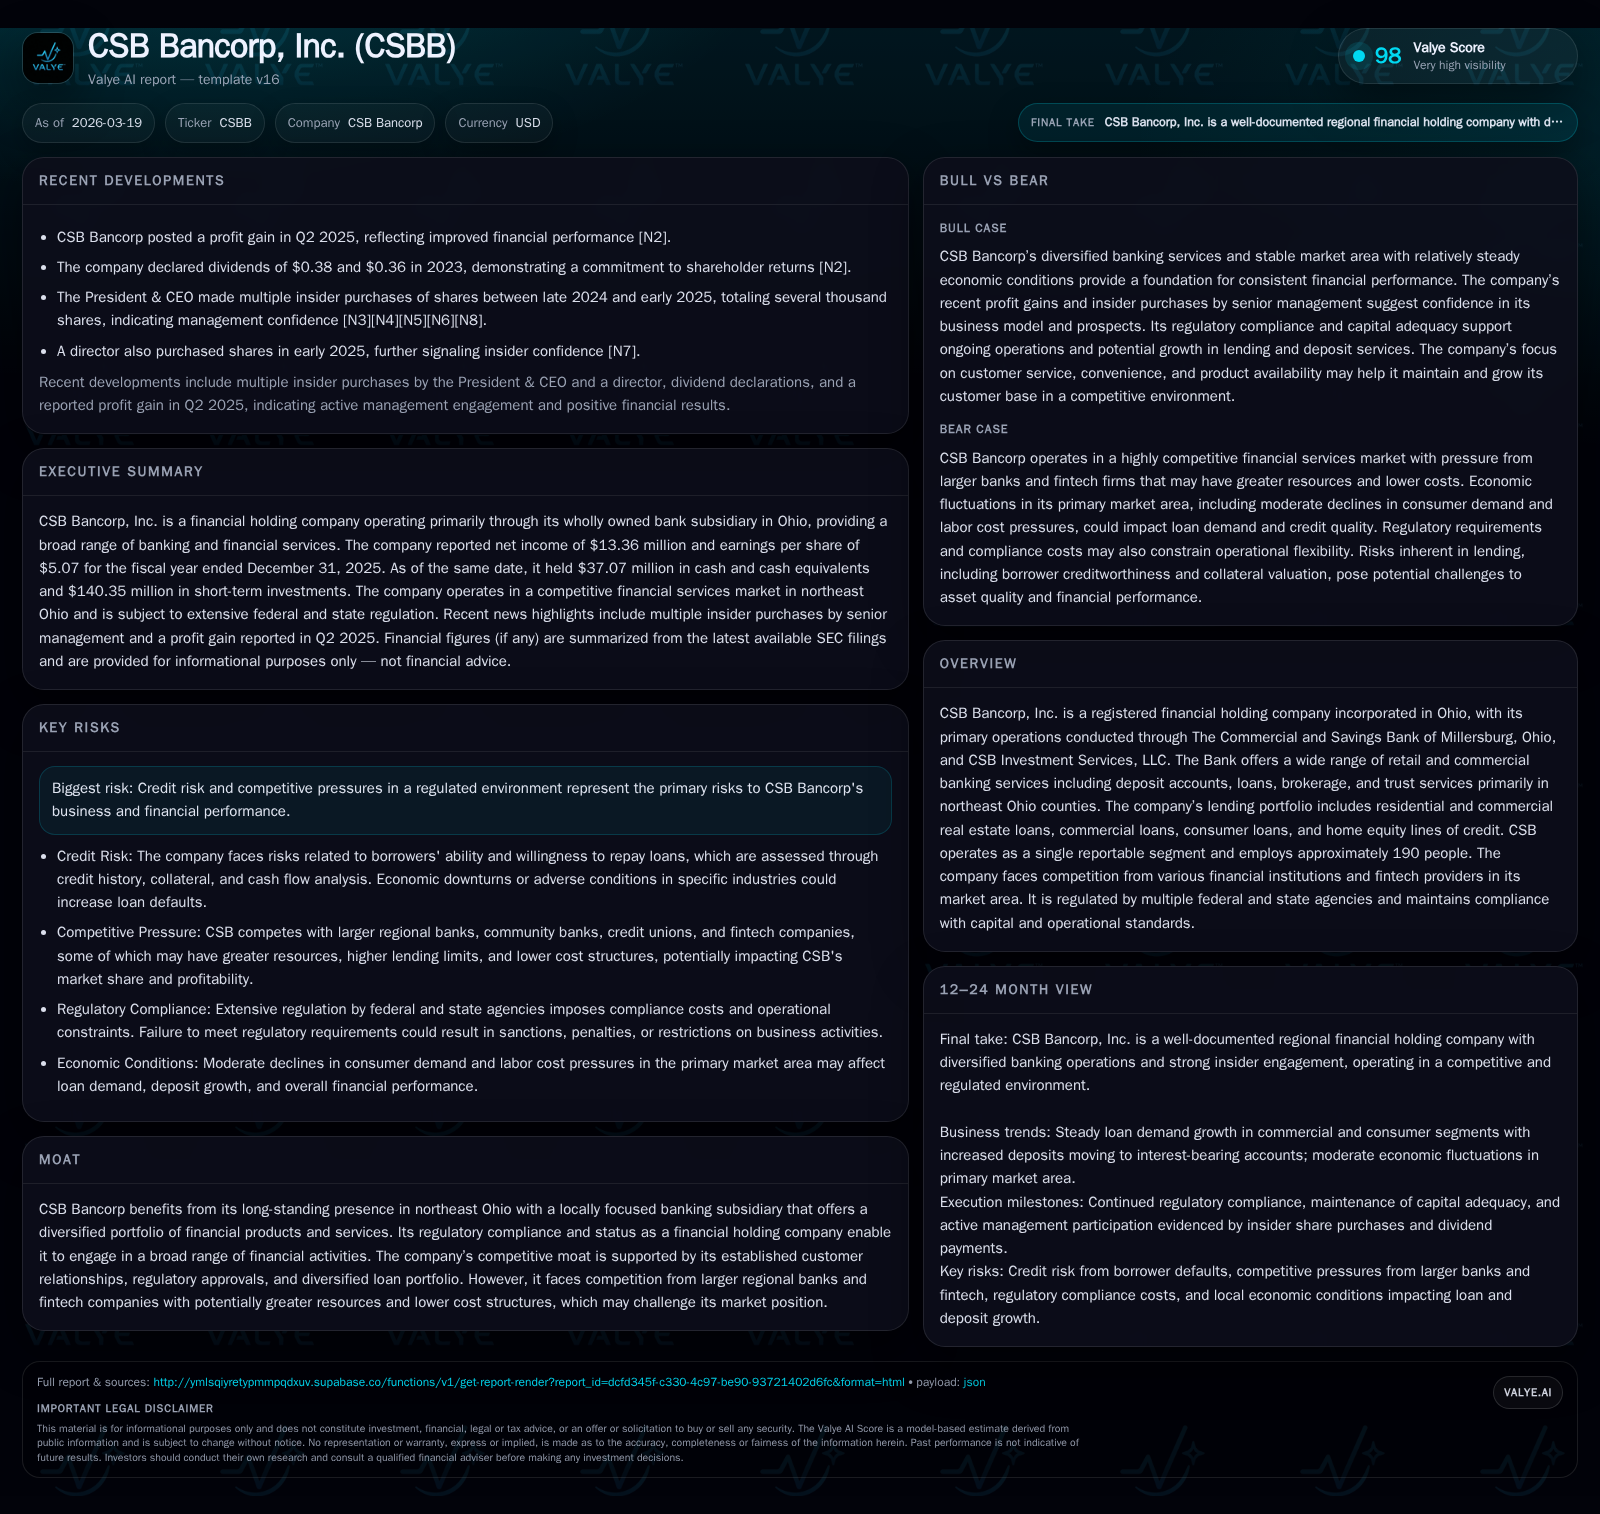
CSB Bancorp demonstrates a significant net income recovery in 2025, navigating competitive and regulatory challenges in northeast Ohio's banking landscape.
CSB Bancorp posted a marked 33.5% increase in net income for fiscal year 2025 compared to 2024, supported by robust operating cash flow growth and disciplined capital management. Its diversified loan portfolio and prudent credit risk framework underpin stable operations despite heightened competition from regional banks and fintech entrants. Regulatory compliance with Basel III requirements, alongside effective capital allocation through dividends and modest buybacks, reflects the company's sustainable financial health. Looking ahead, CSB's profitability will hinge on local economic conditions, credit quality dynamics, and evolving regulatory pressures.
From Volatile Earnings to Sustainable Profit Growth: Historical Trajectory
CSB Bancorp exhibited a noteworthy rebound in net income during fiscal year (FY) 2025, generating $13.36 million—a robust increase of approximately 33.5% relative to the $10.01 million reported in FY2024 [F1]. This follows earlier fluctuations where net income dipped from $14.76 million in FY2023 down to $10.01 million in FY2024 before recovering. The resurgence aligns with a combination of improved loan revenue streams amid stable interest rate environments in northeast Ohio counties served by the Bank [S4] and enhanced operational efficiencies.
This upward earnings trajectory also coincides with growth in shareholder equity which expanded to about $126.28 million by end-FY2025 from $114.84 million the previous year [F1]. Consequently, implied return on equity (ROE) stands near 10.6%, indicating stronger capitalization performance that supports ongoing profitability enhancements.
Increasing operating cash flow lends further support to earnings durability—with CFO rising by nearly 24.5% year-over-year to approximately $19.5 million in FY2025—signaling sound cash conversion from core banking activities [F1]. This strength is crucial as it underscores underlying financial health beyond headline net income figures.
Historical performance (annual)
| FY | Net ($mm) | CFO ($mm) | Capex ($) | Net YoY |
|---|---|---|---|---|
| 2025 | 13 | 19 | 412000 | +33.5% |
| 2024 | 10 | 16 | 1960000 | -32.1% |
| 2023 | 15 | 16 | 424000 | +293.2% |
| 2022 | 4 | 14 | 366000 |
Source: SEC companyfacts cache [F1].
Capital returns and efficiency (annual)
| FY | Div ($mm) | Buybacks ($) | FCF ($mm) |
|---|---|---|---|
| 2025 | 4 | 999000 | 19 |
| 2024 | 4 | 762000 | 14 |
| 2023 | 4 | 1425000 | 15 |
| 2022 | 4 | 388000 | 14 |
Source: SEC companyfacts cache [F1].
Table illustrates gradual improvement with clear earnings reversal post-2024 dip; capex sharply reduced in FY2025 enhancing free cash flow.
Loan Portfolio Composition and Credit Risk Management Framework
CSB’s lending arm demonstrates balanced diversification across residential real estate loans, commercial real estate financing including construction and permanent mortgages, commercial loans secured typically by business assets or guarantees, as well as consumer loans encompassing home equity lines of credit and installment loans [S1][S4]. The geographic focus remains primarily within Holmes, Stark, Tuscarawas, Wayne counties plus neighboring areas of northeast Ohio.
Risk management practices feature multi-tiered controls: internal credit department conducts annual risk ratings on commercial loans exceeding $500,000 while an independent third-party loan review firm performs sampling on watch list credits over specified thresholds—providing oversight on grading accuracy and impairment identification [S8]. Problematic loans above $100,000 receive targeted action plans subject to quarterly internal reviews involving the Executive Committee of the Board.
The Bank adopts conservative underwriting standards such as maintaining commercial real estate loan-to-value ratios typically not exceeding 80%, ensuring collateral adequacy correlates with borrower cash flows for principal and interest coverage assessments [S8]. Residential exposures carry standard fixed or variable rates secured by property titles.
This structured approach mitigates concentration risk while enabling responsiveness to increased demand noted for commercial real estate loans during the past year—a reflection of improving local economic activity albeit tempered consumer spending [S4]. That said, consumer installment credit softened somewhat alongside softer goods demand trends.
Operating Cash Flow Trends and Capital Expenditures: Financial Health Insights
CSB’s operating cash flow performance reinforces its core strength—rising steadily from $15.67 million in FY2024 to almost $19.5 million in FY2025 (+24.5%) supported by improved revenue dynamics encompassing loan interest collections and fees [F1].
Concurrent with this positive trend is a sharp contraction in capital expenditures—from $1.96 million in FY2024 down to a modest $412 thousand in FY2025—representing a decline of roughly 79%. The sizable capex reduction notably expands free cash flow capacity (estimated around $19 million) enabling greater financial flexibility without resorting to external funding sources.
Lower investment outlays appear partly driven by completed branch or technology-related projects with current levels sufficient for routine maintenance purposes rather than expansion initiatives . This cash-rich position facilitates internal funding for strategic priorities.
Capital Allocation, Dividend Strategy, and Share Repurchases in Context
The company’s capital return philosophy balances steady dividend growth alongside measured share repurchase programs reflecting confidence yet prudence within a regional banking context.
Annual dividends increased moderately from approximately $3.53 million paid out in FY2022 to about $4.32 million by FY2025—a sign of commitment to rewarding shareholders progressively aligned with earnings improvements [F1][S3]. Meanwhile, repurchase activity fluctuated but remained relatively conservative; FY2025 buybacks totaled just under $1 million compared to higher volumes in prior years around ~$1.4 million in FY2023 before tapering again [F1].
This approach suggests preservation of capital buffers amid an evolving regulatory environment while still providing liquidity back to investors.
Regulatory Capital Adequacy and Basel III Compliance Dynamics
CSB operates within stringent supervisory frameworks dictated by U.S federal regulators implementing Basel III risk-based capital guidelines adjusted for smaller banking organizations under applicable relief statutes [S5][S7].
Minimum thresholds include common equity tier 1 (CET1) at least of 4.5%, tier 1 capital at least of 6%, total capital ratio at least of 8%, and leverage ratio minimum at 4%. CSB's subsidiary Bank reportedly exceeds these minimums sufficiently to be designated 'well capitalized' as per December-end metrics—with CET1 common equity components chiefly comprising common stock issued plus retained earnings minus regulatory deductions such as goodwill or deferred tax assets per prescribed rules [S14][S19].
Since January 2023 the Bank adopted the Current Expected Credit Losses (CECL) accounting methodology impacting allowance calculations for credit impairments along with phased-in effects on regulatory capital—a development closely tracked within risk-weighted asset assessments under Basel norms [S6][S14].
The Federal Reserve Board’s Small Bank Holding Company Policy exempts CSB from consolidated holding company capital requirements provided asset size remains below prescribed thresholds (~$3 billion), though the Bank itself remains subject to direct regulatory standards given its scale [S7].
Prompt Corrective Action provisions remain relevant safeguards demanding sustained capitalization levels avoiding restrictions such as brokered deposit bans or dividend limitations linked directly to buffer shortfalls below defined ratios [S19].
Market Positioning Against Regional Banks and Emerging Fintech Competitors
CSB leverages entrenched customer relationships cultivated over decades within its Northeast Ohio markets alongside a comprehensive product suite spanning deposits through brokerage/trust services offered via its wholly owned subsidiaries—the Commercial & Savings Bank plus CSB Investment Services LLC [S1].
Nevertheless competitive pressures intensify due to consolidation among larger regional banks boasting greater resources enabling higher lending limits and cost efficiencies unavailable at CSB’s scale [S17]. Moreover fintech companies growing presence enhances alternative digital channels attractive especially for retail customers seeking convenience combined with competitive pricing structures.
Management identifies key competitive success factors including personalized customer service quality, product availability breadth, reputation strength locally alongside interest rate competitiveness amid evolving market conditions favoring digital offerings increasingly popular among younger demographics or tech-savvy consumers [S17].
Going forward sustaining relevance will likely depend on continued investment selectively targeting service digitization balanced against core community banking values resistant to commoditization.
Forward-Looking Risks and Opportunities Based on Company Disclosures
Primary risks stem from credit risk volatility especially linked to borrowers’ repayment ability amid softening consumer spending environments coupled with modest upward labor cost pressures triggered by tight local labor markets that could affect expense structures negatively [S4]. Real estate sector inventory increases signal potential downward pressure on collateral valuations necessitating vigilant monitoring given sizeable related loan exposures.
While regulatory uncertainties exist due to potential future amendments impacting operations or compliance costs—the company has positioned itself conservatively maintaining strong capital reserves enhancing resilience even if localized economic headwinds emerge unexpectedly [S10][S14].
Opportunities involve capturing growth momentum through incremental commercial real estate lending expansions amidst stable interest rates supporting demand plus possibilities for cross-selling wealth management products via integrated subsidiaries enhancing fee income streams if executed deftly.
Key Metrics to Monitor: What Comes Next for CSB Bancorp?
Absent explicit company forecasts publically available at this juncture apart from dividend declarations reported in February quarterly filings indicating ongoing payout continuity [S3], attention should focus on quarterly updates detailing:
- Loan portfolio quality developments including nonperforming asset trends or charge-offs reflecting economic shifts,
- Regulatory capital ratios evolution post-CECL phase-in periods,
- Dividend payment adjustments signaling confidence levels,
- Share buyback authorizations reflecting surplus liquidity stance,
- Competitive positioning maneuvers or partnerships addressing fintech disruption. Collectively these variables will shape near-term strategic execution efficacy amid fluid banking sector macro conditions influencing regional players like CSB Bancorp.
Disclaimer: This report is for informational purposes only based on publicly available data as of March 19, 2026, without any investment recommendation or advice regarding CSB Bancorp or its securities.
Disclaimer: This is research-only, informational analysis and not investment advice. It may include AI-generated interpretation and general industry context. Always verify important details using primary sources.
Comments