
Torrid Holdings’ Q1 2026: Break-Even EPS Highlights Strategic Liquidity and Growth Challenges
Latest quarterly results reveal Torrid’s operational pressures within a competitive plus-size apparel market and balance-sheet constraints.
In its Q1 2026 filing, Torrid Holdings reported break-even earnings per share alongside a liquidity position marked by a current ratio below 1, underscoring near-term financial constraints. The company operates in the specialty apparel retail segment targeting plus-size consumers through an omnichannel approach balancing brick-and-mortar stores and e-commerce. While its product assortment and customer loyalty initiatives support revenue generation, Torrid faces challenges from competitive pricing pressures, inventory management demands, and evolving consumer preferences. Growth hinges on enhancing e-commerce penetration, managing inventory turnover effectively, and maintaining relevant product innovation amid sector-wide risks including liquidity strain and market competition.
Latest Quarterly Performance and Operating Update
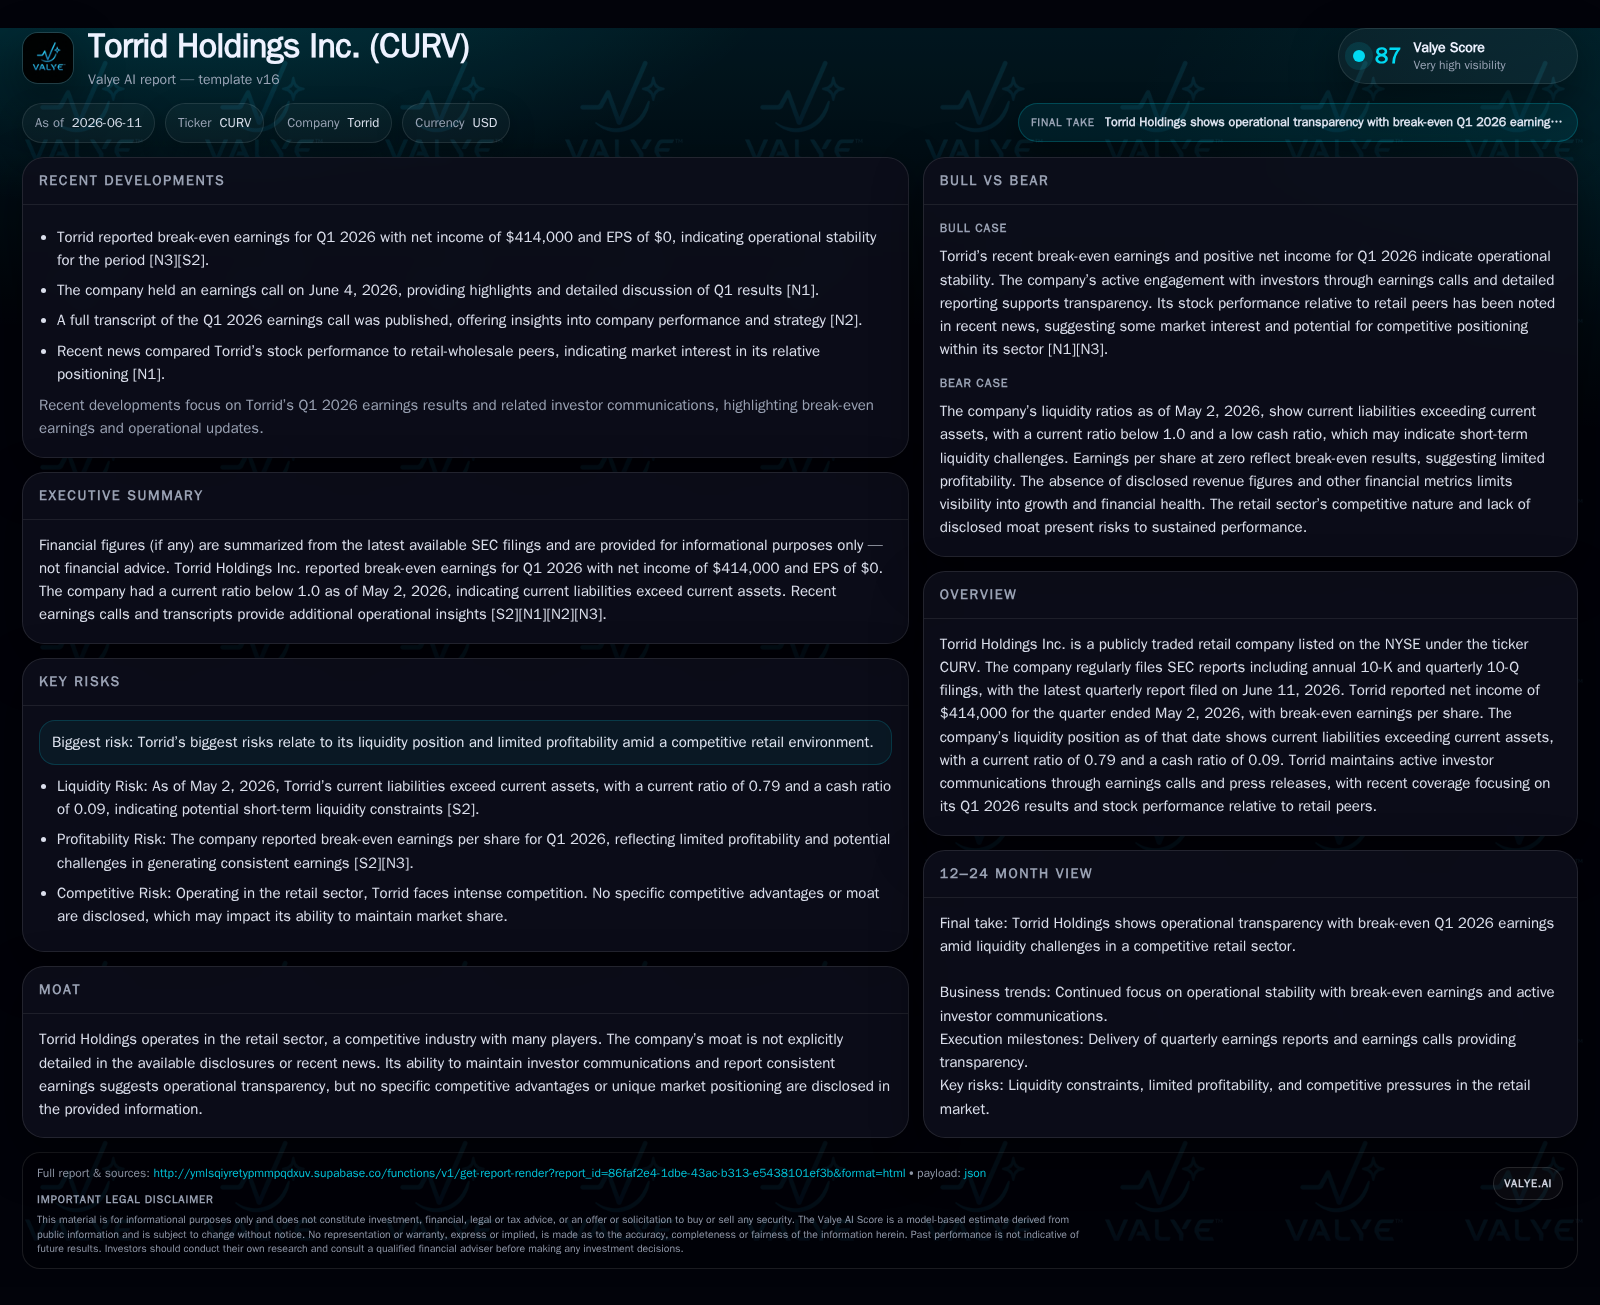
Torrid Holdings’ fiscal Q1 2026 performance, detailed in the June 11, 2026 SEC Form 10-Q filing [S2], reveals a pivotal inflection point: the company reported break-even earnings per share for the quarter ended May 2, 2026. Although net income was nominally positive at $414,000 by some reports, the official filings highlight an earnings outcome signaling tight profit margins reflective of persistent competitive pressure in the specialty apparel sector [N3]. Liquidity remains constrained; the current ratio stood at approximately 0.79 with current liabilities surpassing current assets ($260 million vs. $204 million) as of quarter-end [F1][S2]. Furthermore, with a cash ratio near 0.09 — indicative of limited immediate cash coverage against short-term obligations — operational flexibility is notably restricted.
This financial snapshot underscores two interlinked challenges: maintaining profitability amid competitive pricing dynamics and managing liquidity prudently to support working capital needs [N1]. The company’s continued disclosure of results through active investor communications during earnings calls enhances transparency but also signals heightened scrutiny around its ability to navigate these headwinds going forward
Business Model Overview: Serving the Plus-Size Specialty Apparel Segment
Torrid Holdings primarily generates revenue by designing, sourcing, marketing, and selling apparel targeted specifically at plus-size consumers — a niche within the broader specialty apparel retail industry [S1]. Its operating model combines physical stores with e-commerce platforms to provide omnichannel access to its curated product assortments. This dual channel approach allows Torrid to tap both traditional foot traffic and digitally native shoppers. Functionally, revenue depends on driving same-store sales growth complemented by expanding online sales penetration.
The company focuses on offering fashion-forward plus-size clothing that aligns with customer preferences in fit and style. Pricing strategy plays a crucial role in balancing gross margin preservation against markdowns necessitated by inventory obsolescence or competitive discounting cycles — key margin levers in specialty retailing. Inventory turnover is therefore central to minimizing markdown rate erosion while optimizing availability.
Additionally, Torrid invests in customer loyalty programs aiming to deepen engagement and incentivize repeat purchasing behavior. These programs enhance average transaction values and support retention in a segment where specialized fit drives brand affinity but also heightens sensitivity to product relevance.
While Torrid does not disclose explicit proprietary moats beyond brand recognition within its niche, its concentration on plus-size fashion positions it strategically against broader mass-market apparel chains lacking focused assortments. Nonetheless, this niche focus entails exposure to segment-specific demand shifts.
Industry Structure and Competitive Positioning in Specialty Apparel Retail
The specialty apparel retail landscape is characterized by intense competition among peers focusing on differentiated segments such as plus-size offerings, fast fashion responsiveness, or luxury niches. Companies benchmark success using KPIs like same-store sales growth rates—reflecting organic demand strength—and gross margin percentages indicating pricing power combined with inventory efficiency.
Gross margin compression often reflects promotional intensity driven by competitor discounting—a common theme in middle-tier specialty chains—while inventory management challenges can elevate markdown rates if assortments lag trend cycles.
Moreover, e-commerce penetration continues to reshape channel economics across the industry; digital sales command attention due to lower overhead and higher convenience but require significant technological investments. Torrid’s relative footprint must therefore balance maintaining store count appropriate to brand reach without diluting profitability through scale inefficiencies or cannibalization between physical and online channels.
Growth Drivers: Omnichannel Expansion and Product Innovation
Looking ahead, Torrid’s growth strategy orbits around deepening omnichannel integration to elevate e-commerce penetration beyond current levels—a critical vector given shifting consumer preferences towards mobile shopping experiences. Enhanced omnichannel retailing improves fulfillment cost efficiencies by leveraging centralized inventories across channels while enhancing customer experience through seamless purchasing paths.
Innovation within product assortments remains vital. Responsiveness to fashion trends tailored for plus-size consumers helps mitigate risks from inventory obsolescence and supports premium pricing potential. Loyalty programs complement these initiatives by fostering customer retention that stabilizes average order value metrics.
Although recent filings do not detail new store openings explicitly, strategic physical footprint adjustments remain an option to sustain brand visibility or penetrate underserved markets.
Potential partnerships with influencers or designers could further differentiate offerings but require execution discipline given delicate margin environments.
Risks and Constraints: Liquidity Challenges and Market Competition
Primary risks identified reflect Torrid’s liquidity shortfall exacerbated by current liabilities outpacing assets (current ratio <1) which could constrain operational agility amidst unexpected expenses or supply chain disruptions [S2][S17]. Competitive pressures manifest chiefly through pricing discounting that threatens gross margin resilience. Elevated markdown rates may become necessary if inventory turnover slows due to rapid fashion cycle shifts or poor assortment alignment.
The labor-intensive nature of retail combined with supply chain uncertainties compounds these risks by increasing costs or causing stockouts detrimental to customer satisfaction.
Consumer migration toward online shopping demands continuous investment in digital infrastructure; failure to upgrade effectively may result in lost market share versus more agile peers. Seasonality effects inherent in apparel demand add complexity to inventory planning cycles.
Brand reputation risk remains a latent factor if product quality or social responsibility issues arise within this demographic-sensitive segment.
What to Watch Next: Operational Milestones and Market Indicators
Future scrutiny should focus on sequential changes in comparable same-store sales reflecting core demand health beyond channel mix effects. Tracking improvements in e-commerce sales share will indicate success in digital adoption strategies critical for long-term competitiveness.
Management commentary on cost control measures—particularly operating expense leverage—is an essential indicator of pivot toward sustainable profitability levels post-break-even EPS quarter.
Monitoring changes in average order value alongside loyalty program participation metrics provides insight into customer engagement depth vital for revenue stability amidst cyclical industry vagaries.
Any announcements regarding new store openings or closures will signal strategic rebalancing of physical presence possibly aligned with evolving consumer traffic patterns post-pandemic era dynamics.
Financial Snapshot Analysis: Balancing Profitability with Leverage
Supporting this operational narrative is Torrid’s firm financial stance reflected at Q1-end: net income hovered near zero suggesting ongoing challenges converting revenue growth into meaningful profitability despite positive operating income reported previously [F1][S2]. The liquidity position shows working capital pressures with current assets at $204 million lagging behind $260 million current liabilities [F1], resulting in a constrained current ratio of 0.79 that limits runway for opportunistic investments or buffer against economic shocks.
Total debt approximates $289 million against cash equivalents of roughly $23 million placing net debt burden close to $266 million as per latest available data [F1]. This leverage level accentuates sensitivity to any downturns impacting cash flow generation capacity.
Consequently, operational efficiency enhancements paired with cautious balance-sheet management will be critical levers as Torrid navigates a challenging retail environment demanding fluid adaptability between physical retail legacy structures and disruptive digital commerce forces.
This analysis is based solely on publicly filed SEC disclosures from Torrid Holdings Inc., supported by industry knowledge frameworks typical of specialty apparel retail companies focusing on niche segments like plus-size fashion. It does not offer investment advice but aims to provide an informed perspective integrating recent operating performance with sector-specific dynamics relevant as of June 2026.
Financial position in context
As of 2026-05-02, companyfacts shows $23mm in cash and equivalents [F1]. Current assets of $204mm and current liabilities of $260mm imply a current ratio near 0.79x for 2026-05-02 [F1].
Disclaimer: This is research-only, informational analysis and not investment advice. It may include AI-generated interpretation and general industry context. Always verify important details using primary sources.
Comments