
Lovesac’s Q1 2027 Results Spotlight Showroom Expansion Amid Margin Pressure
Lovesac’s latest quarter reveals steady showroom-driven revenue growth counterbalanced by rising costs and supply chain challenges.
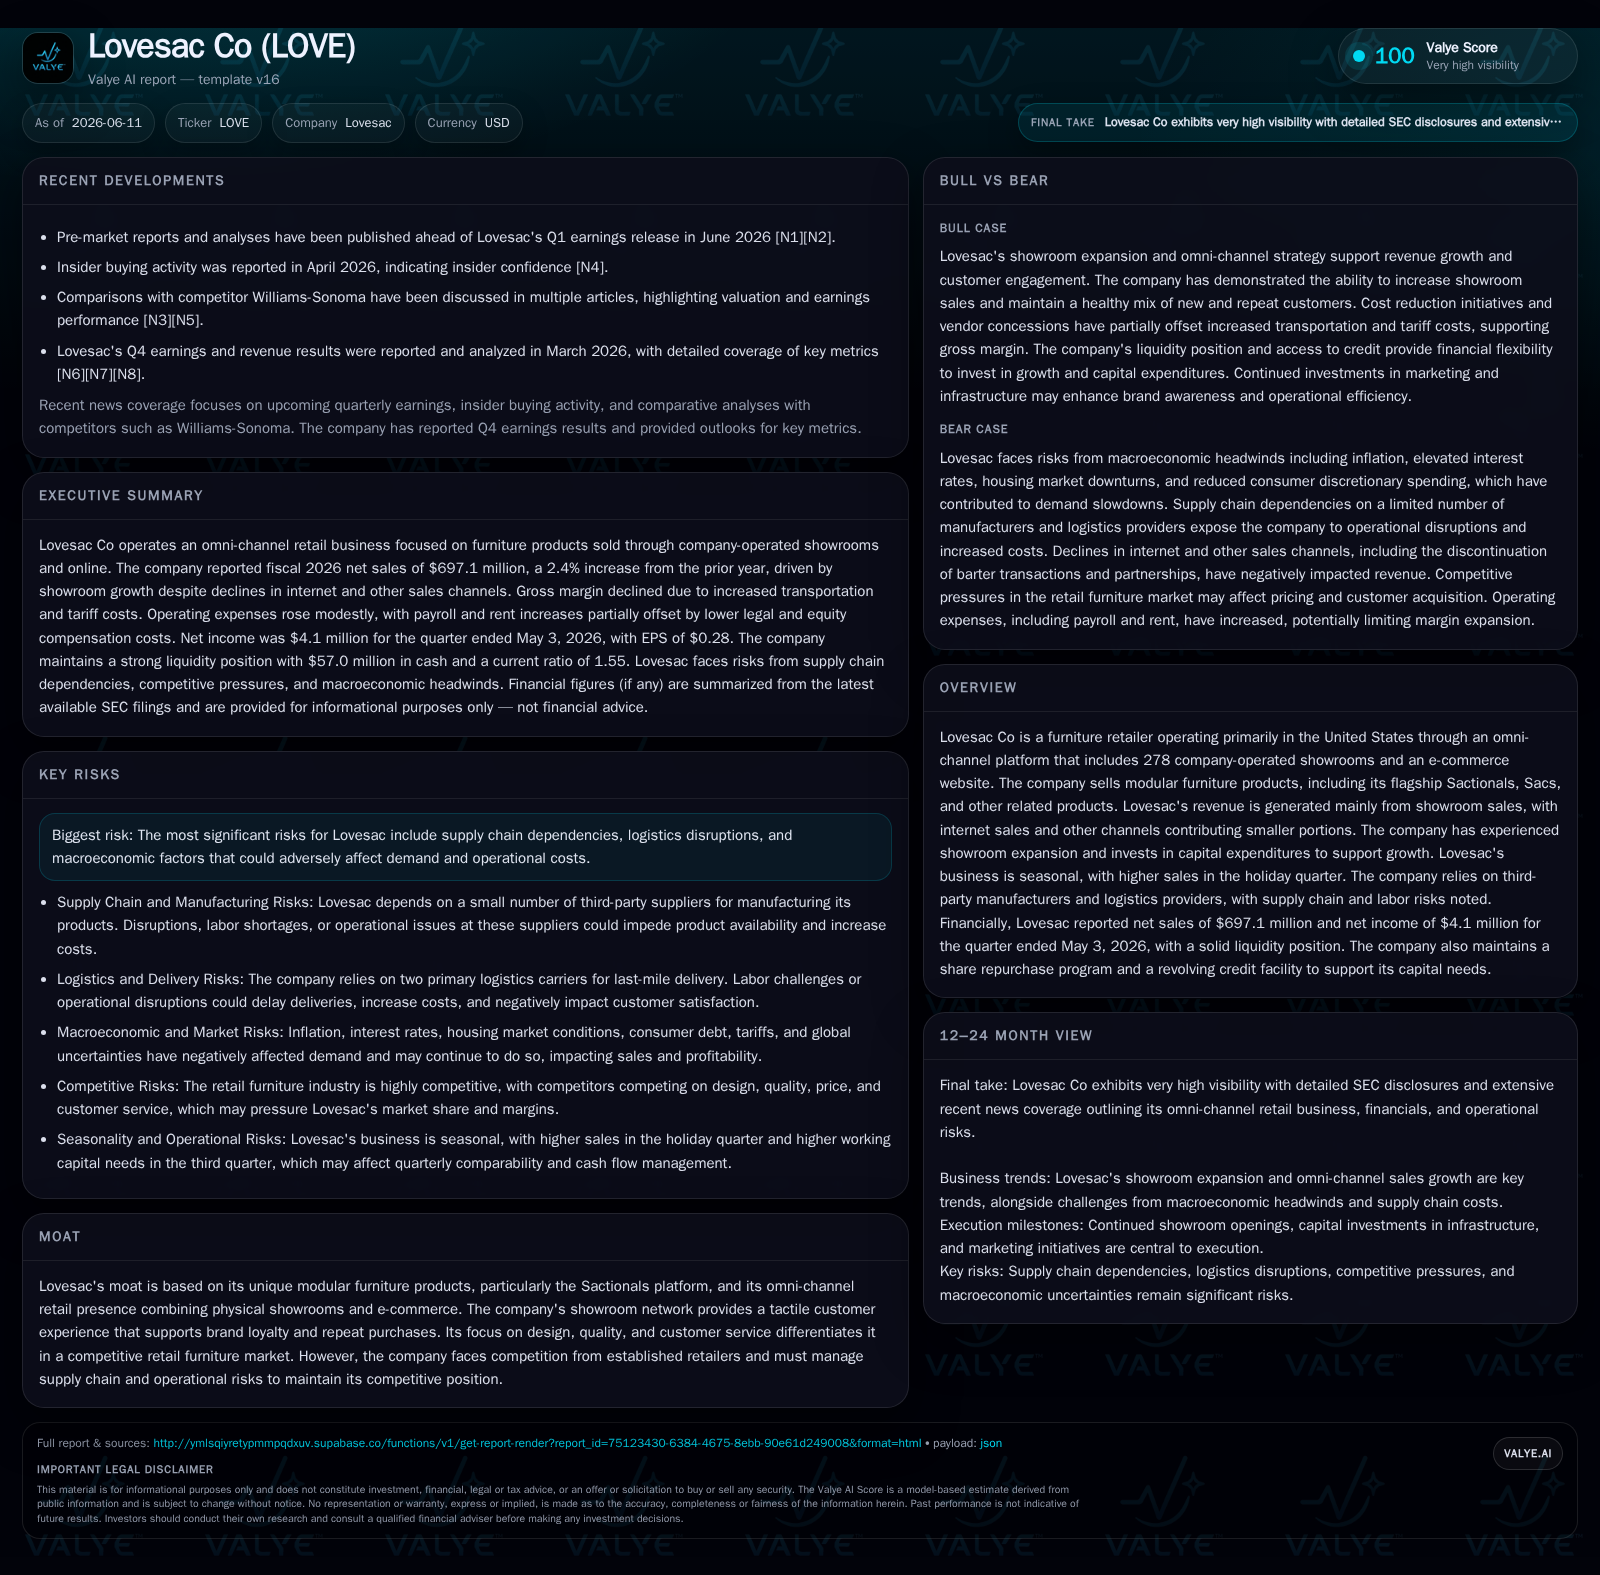
In the quarter ended May 3, 2026, Lovesac Co reported net sales of $697.1 million and a net income of $4.1 million, underlining modest profitability amid ongoing showroom expansion efforts. The company’s business model centers on integrated omni-channel retailing of modular furniture, primarily through its network of 278 showrooms combined with e-commerce. While sales growth is partly fueled by physical footprint expansion, margin contraction and elevated SG&A weigh on operating income, reflecting industry-wide pressures including supply chain complexities and seasonality effects. Going forward, Lovesac aims to balance showroom investments with efficiency improvements to enhance gross margin and capitalize on product differentiation in a competitive retail furniture environment.
Recent Operating Update
The earnings release accompanying the quarterly filing emphasized showroom network growth as central to revenue enhancement but acknowledged ongoing supply chain cost pressures and investment phase expenses impacting profitability [S3]. This quarter-level performance marks a continuation of episodic seasonal trends typical for the retail furniture sector where holiday quarters deliver disproportionate sales volumes.
Business Model Analysis
Lovesac operates an omni-channel retail platform specializing in modular home furnishings including flagship Sactionals and Sacs products prominently sold through company-operated showrooms and an e-commerce website [S1]. Approximately two-thirds of revenues are derived from physical showroom sales where customers benefit from direct tactile experiences critical to modular furniture buying decisions. The remaining revenue primarily stems from online sales complemented by other channels.
Revenue mechanics hinge on unit volume sold through these channels and average order value which is positively influenced by the modular furniture system’s scalable design that encourages add-on purchases. Pricing power is supported by product differentiation based on design innovation and branding but is subject to competition from both specialty furniture retailers and mass-market chains.
Margins depend heavily on cost management in sourcing raw materials internationally, inbound freight logistics, warehousing, and distribution expenses [S11][S14]. The company pursues gradual domestic manufacturing shifts intended to improve supply chain reliability though these initiatives require upfront investment.
Customer acquisition mixes approximately equal shares of new versus repeat consumers (~50% repeat transactions in fiscal 2026), underscoring moderate success in loyalty retention balanced against continued marketing spend focused on brand awareness [S21]. Showroom operations also incur fixed rental and payroll costs which create leverage opportunities as volume scales but pressure SG&A when demand softness arises.
Industry Structure & Competitive Position
Lovesac sits within the retail furniture industry characterized by omni-channel operations blending online and physical presence — a model similarly pursued by peers like Williams-Sonoma (omni-channel specialty) and Wayfair (e-commerce dominant). However, Lovesac’s distinct product focus on modular furniture creates strategic differentiation that competes less on price alone than on quality, design flexibility, and brand experience.
The showroom network is a unique moat element offering tactile engagement unmatched by pure e-commerce retailers but invites capital intensity risks linked to real estate leases amidst evolving consumer shopping patterns. Additionally, the company faces industry-wide competition challenges including pricing pressure, customer attention fragmentation, and supply chain vulnerabilities exacerbated by global logistics fluctuations.
Growth Drivers
- Showroom Expansion: Continued rollout of physical showrooms remains a key pillar for sequential revenue gains with 28 showrooms opened in fiscal year 2026 supporting customer acquisition and higher average basket sizes [S22].
- E-commerce Penetration: While showroom sales dominate, a stable ~28% internet sales contribution offers reach beyond physical footprint constraints.
- Product Innovation: Modular design aesthetics combined with new product introductions stimulate repeat purchase potential.
- Marketing Investments: Increased advertising spend aims to boost brand visibility and customer inflow across channels.
- Supply Chain Optimization: Efforts towards domestic manufacturing seek to reduce tariff impacts and improve inventory turnover ratios over time.
Risks & Constraints
- Supply Chain Dependencies: Heavy reliance on third-party international manufacturers exposes Lovesac to tariffs, labor shortages, or logistic delays affecting inventory availability.
- Seasonality: Significant quarterly revenue volatility tied to holiday seasons complicates demand forecasting.
- Fixed Cost Absorption: Increasing showroom base inflates fixed overhead costs which can depress margins during periods of weak traffic or soft consumer spending.
- Macroeconomic Sensitivities: Inflationary pressures on raw materials coupled with elevated interest rates may curtail consumer discretionary spending on premium home furnishings.
- Competitive Pressures: Established mass-market chains and e-commerce specialists compete aggressively across price points challenging Lovesac's premium positioning.
What To Watch Next
Key execution points include monitoring comparable omni-channel sales growth at existing showrooms, quarterly same-store sales performance especially approaching peak holiday seasonality periods, gross margin trajectory driven by cost containment or inflation pass-through capability, updated capital expenditure pacing especially related to new showroom development, customer retention metrics amid marketing spend changes, plus any revisions in guidance communicated post next quarter result announcements [N1][N2][S3]. Supply chain stability indicators will also be crucial given recent volatility impacting operating consistency.
Financial Profile Snapshot
As of Q1 FY27 end (May 3, 2026), Lovesac carried $57 million cash equivalents against current liabilities of approximately $128 million resulting in a current ratio near 1.55 — indicating reasonable liquidity [F1]. Operating income was $5.36 million on $697 million revenue marking slim operating margin just below 1%, evidencing investment phase drag amid capacity scaling. SG&A expenses consumed about 40% of sales reflecting fixed-cost burdens alongside scaling marketing efforts [F1][S22].
Liquidity appears sufficient for near-term operating cycles while share repurchase programs authorized signal board confidence in capital allocation potential over time [S27]. Close attention should be paid to evolving margin trends given their impact on free cash flow sustainability during Lovesac’s growth investments.
This analysis utilizes the most recent quarterly disclosures alongside annual context without extrapolating future projections. It focuses strictly on publicly filed information without subjective forecasting or investment research views.
Financial position in context
As of 2026-05-03, companyfacts shows $57mm in cash and equivalents, current assets of $199mm and current liabilities of $128mm implying a current ratio near 1.55x [F1]
Disclaimer: This is research-only, informational analysis and not investment advice. It may include AI-generated interpretation and general industry context. Always verify important details using primary sources.
Comments