
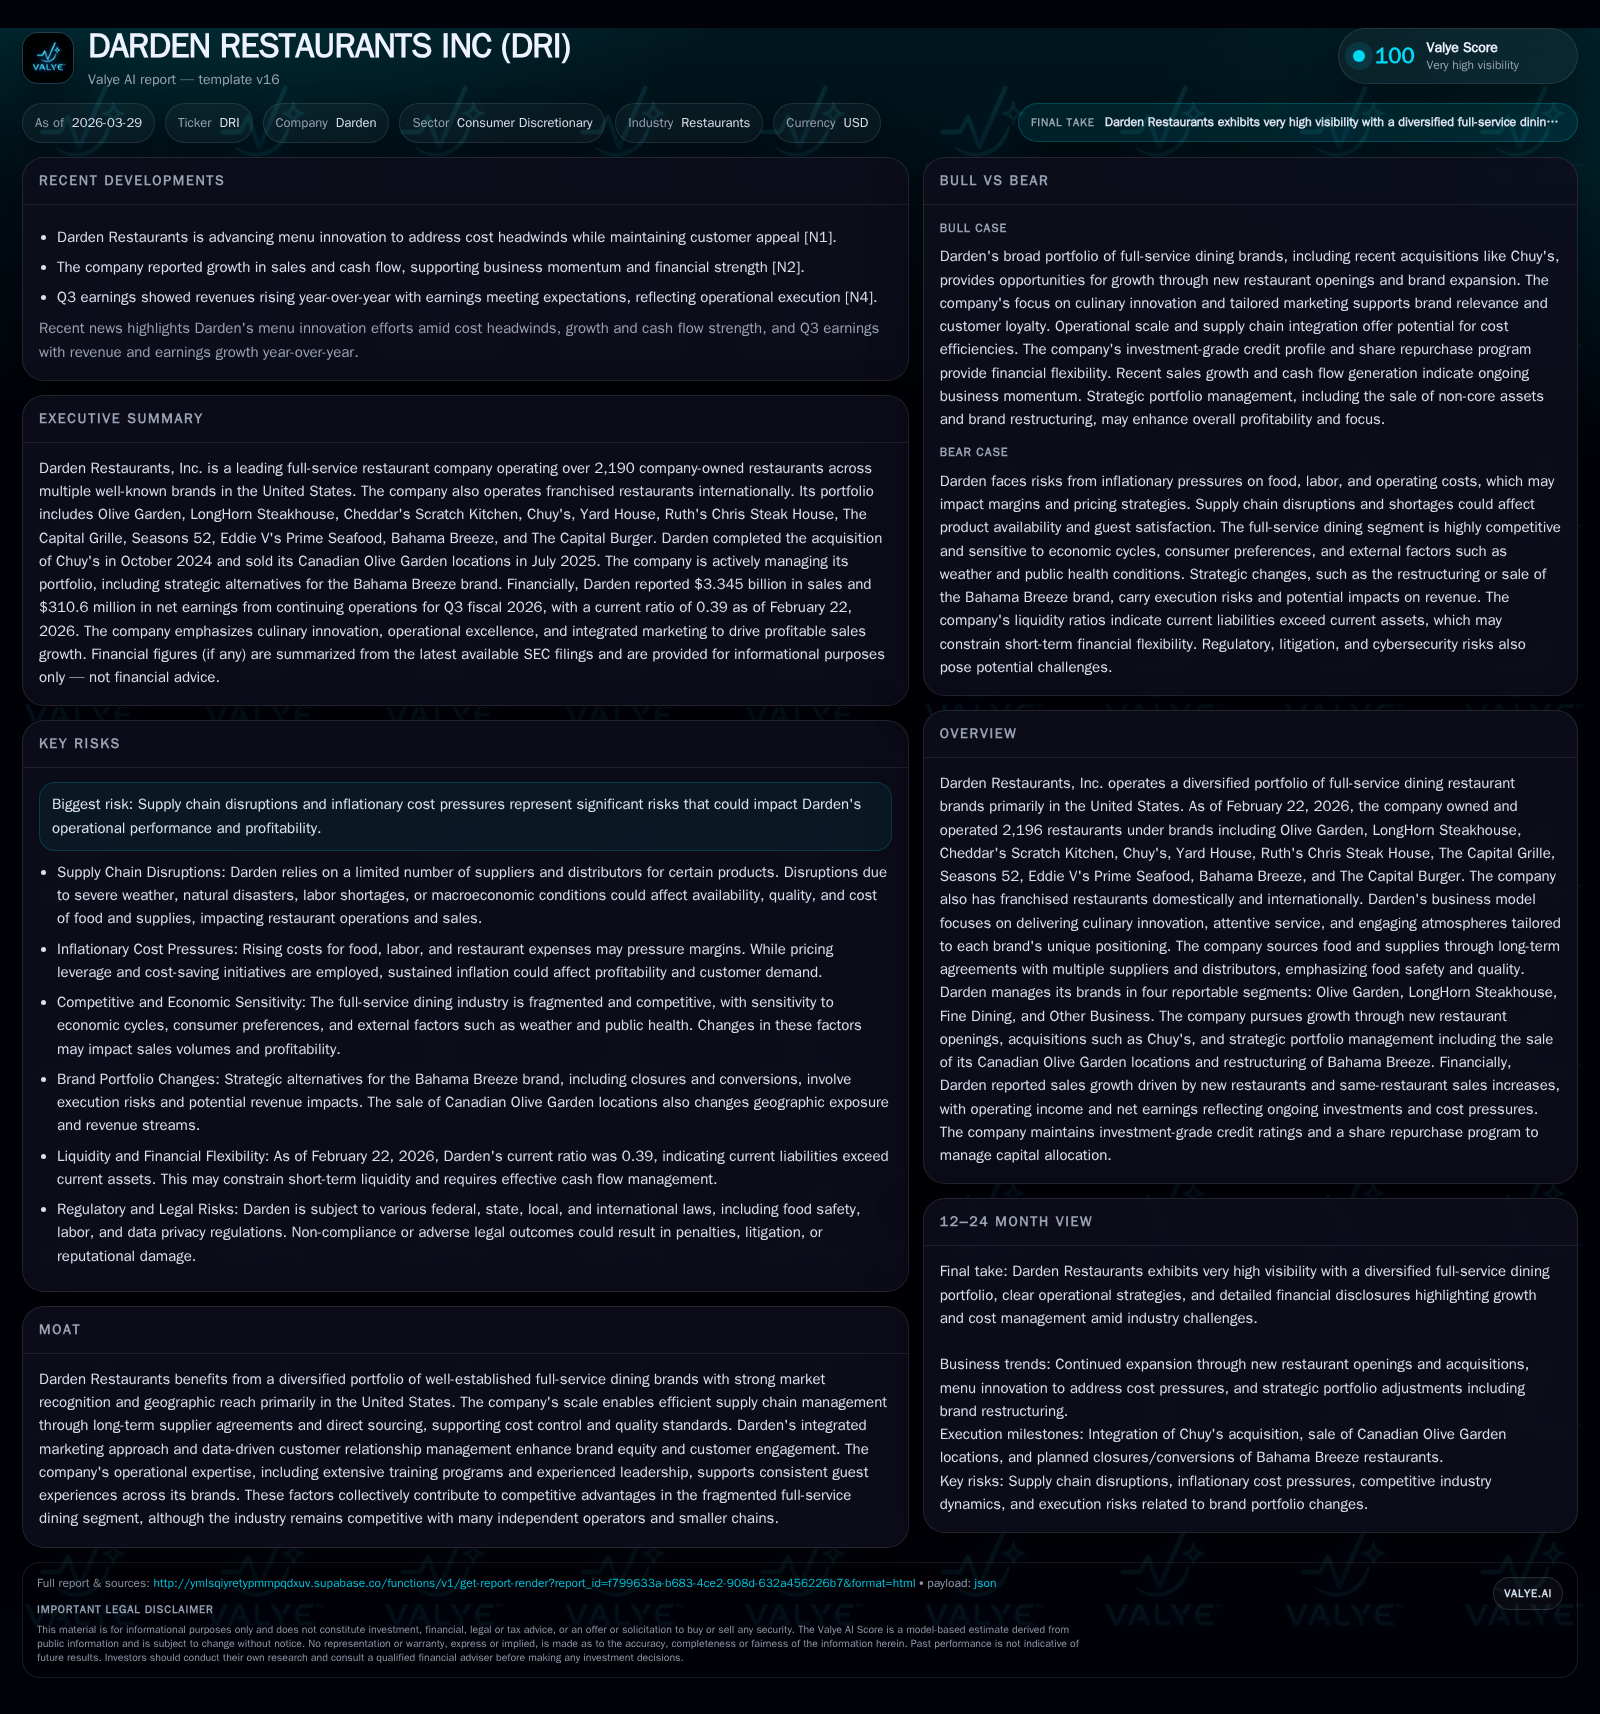
Darden Restaurants' Resilient Growth and Dynamic Brand Portfolio
Darden leverages its diverse restaurant brands, culinary innovation, and disciplined capital management to sustain growth amid cost pressures and evolving consumer preferences.
Darden Restaurants operates a broad portfolio of full-service dining brands that have consistently driven top-line growth through strategic expansion and operational efficiencies. Rising inflationary costs in food and labor pose margin challenges; however, menu innovation and brand-specific marketing bolster customer engagement. Fiscal 2026 shows stable revenue acceleration and prudent capital allocation, with strong cash flow underpinning dividends and share repurchases. Despite robust fundamentals, supply chain interruptions and wage inflation remain significant risks in a competitive landscape.
Growth Acceleration Driven by Portfolio Expansion and Operational Excellence
Darden Restaurants’ trajectory through the recent years underscores steady revenue growth powered by its diversified brand portfolio encompassing Olive Garden, LongHorn Steakhouse, Cheddar’s Scratch Kitchen, among others [S1][S2]. The company operated approximately 2,196 restaurants as of early 2026 [N1], reflecting expansions primarily concentrated in flagship brands Olive Garden (increased from 927 to 944 units between FY2025 Q3 and FY2026 Q3) and LongHorn Steakhouse (from 586 to 608 units) [S2]. This expansion has materially driven Darden’s revenue increase: from $1.79 billion in FY2016 to approximately $1.93 billion in FY2017 [F1]. Later fiscal years sustained this uptrend culminating in a reported operating income of about $1.36 billion for FY2025—representing a year-over-year gain of roughly 3.7%—despite rising cost pressures [F1].
Economies of scale have been instrumental; Darden leverages its size to negotiate long-term agreements with multiple suppliers via Darden Direct Distribution, enabling improved purchasing leverage and food quality control across the portfolio [S26]. These efficiencies have contributed to improving operating leverage despite inflationary trends impacting input costs such as commodities and labor [S1]. In addition to expansion, operational excellence driven by comprehensive training programs enhances guest experience consistency—a critical factor for repeat patronage in full-service dining.
Historical performance (annual)
| FY | Net ($mm) | CFO ($mm) | OpInc ($mm) | Capex ($mm) | Net YoY |
|---|---|---|---|---|---|
| 2025 | 1050 | 1707 | 1362 | 645 | +2.1% |
| 2024 | 1028 | 1622 | 1314 | 601 | +4.7% |
| 2023 | 982 | 1553 | 1202 | 565 | +3.1% |
| 2022 | 953 | 1265 | 1162 | 377 |
Source: SEC companyfacts cache [F1].
Capital returns and efficiency (annual)
| FY | Div ($mm) | Buybacks ($mm) | FCF ($mm) |
|---|---|---|---|
| 2025 | 659 | 418 | 1062 |
| 2024 | 628 | 454 | 1021 |
| 2023 | 590 | 459 | 988 |
| 2022 | 563 | 1071 | 888 |
Source: SEC companyfacts cache [F1].
Table Note: Data sourced from SEC filings aggregated up to FY2025 [F1].
Evolving Cost Structure and Inflationary Pressures Impact Profit Margins
While Darden has realized steady top-line gains, inflationary pressures have created persistent cost headwinds. The company documented elevated prices for key commodities such as beef, pork, poultry, seafood, cheese, butter, and produce throughout fiscal year 2025 – a trend largely linked to global market conditions including tariffs and supply chain constraints [S1]. Labor costs were similarly pressured by increases in minimum wages across several states where Darden operates along with intensified market competition for restaurant workers [S1][S13]. For instance, Q3 FY26 data revealed food & beverage costs rose by about 7.7%, staffing expenses climbed roughly 5%, while general restaurant expenses were up over 5% versus the prior year quarter [S2]. Utilities fluctuations also added complexity due to dependency on electricity and natural gas with occasional regional disruptions noted [S1].
Despite these factors squeezing operating margins somewhat (notably a slight dip in Q3 operating income), the company has countered partial margin erosion through pricing discipline combined with menu engineering innovations aimed at optimizing ingredient efficiency without compromising perceived value [N8][S1]. Nonetheless, these inflationary dynamics require careful balancing as menu price increases risk deterring price-sensitive consumers.
Innovative Menu Strategies Fuel Customer Engagement Amid Rising Costs
Darden’s ability to sustain guest visits through culinary innovation is a notable strength acknowledged across its brand ecosystem [N8][S1]. Each restaurant concept maintains distinct atmospheres reflective of its unique positioning—from casual Italian comfort at Olive Garden to fine dining at The Capital Grille—fostering differentiated customer experiences tailored to evolving consumer tastes.
The company increasingly employs data analytics for targeted promotions aiming at personalized guest engagement while driving repeat business without heavy reliance on discounting [S26][N8]. Menu revisions emphasize fresh ingredients with selective additions that cater both to health-conscious consumers as well as indulgence seekers. This dynamic approach helps preserve average check sizes even amid higher cost inputs.
Fiscal Year 2026: Performance Highlights and Revenue Trajectory
In the third quarter of fiscal year 2026 ending February 22, Darden reported sales of approximately $3.35 billion—a rise of nearly 6% compared to the same period last year—with operating income at $406 million representing a slight decline due largely to pre-opening expenses related to new restaurants [N2][N3][S2]. Earnings per share dipped marginally but remain supported by volume growth across core concepts.
The business saw incremental store count additions: Olive Garden increased its locations slightly from previous periods while LongHorn Steakhouse continued expansion [S2]. The company's guidance revisions indicate optimism towards further revenue acceleration driven by brand extension projects alongside ongoing cost mitigation efforts [N14][S3]. Observers should monitor new unit openings relative to closures alongside margin trends over ensuing quarters as indicators of sustained growth momentum.
Capital Allocation Framework: Shareholder Returns Through Dividends and Buybacks
Darden consistently generates robust cash flows facilitating meaningful shareholder returns while investing in expansion. In fiscal year 2025 alone, dividends amounted to approximately $658 million complemented by share repurchases totaling around $418 million—indicating balance between rewarding shareholders and supporting strategic growth initiatives [F1][S10][S21][S24]. Operating cash flow reached nearly $1.71 billion against capex spend of about $645 million yielding over $1 billion in free cash flow available for debt reduction or additional capital returns [F1].
Return on equity stands close to an impressive calculated value of around 45%, signaling efficient utilization of equity capital especially given the competitive pressures within the restaurant industry segment [F1]. The Board's authorization of a new $1 billion repurchase program reflects confidence in maintaining prudent financial stewardship while managing leverage targets aligned with investment-grade credit profiles.
Balance Sheet Strength Supports Liquidity Despite Elevated Liabilities
Financial disclosures highlight solid liquidity positions characterized by approximately $240 million in cash equivalents coupled with current assets exceeding $1 billion as of late fiscal Q3 2026; however current liabilities surpass $2.6 billion resulting in a low current ratio near 0.39—an indicator of working capital constraints related primarily to high short-term commercial paper issuance ($290 million outstanding backed by revolving credit facilities) alongside unearned revenue balances from gift card sales [F1][S4][S5][S8][S20].
Long-term debt maturity schedules are well distributed including senior notes due between May 2027 through February 2048 carrying fixed coupon rates ranging roughly from mid-3% up to near-7%—enabling manageable interest obligations consistent with BBB ratings maintained by Moody’s, S&P and Fitch agencies [S6][S8][S9]. Overall leverage ratios are closely monitored under agreements restricting covenant breaches thereby maintaining operational flexibility despite cyclical uncertainties.
Risks on the Horizon: Supply Chain Disruptions and Wage Inflation
Darden enumerates significant risks stemming from supply chain fragilities exacerbated by geopolitical tensions affecting commodity availability as well as transportation reliability which could materially impact restaurant operations if unresolved [S1][N9][N10][N11]. Volatility in minimum wages across jurisdictions adds pressure on labor expense structures alongside local regulatory developments governing employment practices presenting compliance challenges potentially inflating payroll costs further [S13][N8].
Additionally, cybersecurity risks associated with handling sensitive customer data impose operational vulnerabilities requiring sustained technology investments; any lapses could impair brand reputation or result in costly litigation or penalties impacting profitability adversely [S14][S15]. Competitiveness within full-service dining remains fierce involving national chains as well as innovative delivery platforms threatening market share unless Darden continues adapting its engagement methods effectively [S19].
Despite these challenges, Darden’s scale advantage through centralized procurement systems coupled with targeted marketing enables more nimble responses compared to smaller competitors—balancing risk exposures while fostering resilience.
This analysis uses data directly cited from Darden Restaurants’ SEC filings ([F1], [S#]) and recent industry news reports ([N#]). It refrains from speculative forecasts beyond identified company disclosures or public statements.
Disclaimer: This is research-only, informational analysis and not investment advice. It may include AI-generated interpretation and general industry context. Always verify important details using primary sources.
Comments