
Eastern Company's Decline in Operating Income Signals Industry Headwinds
Operating income falls sharply as Eastern navigates cost pressures and market slowdown in engineered solutions.
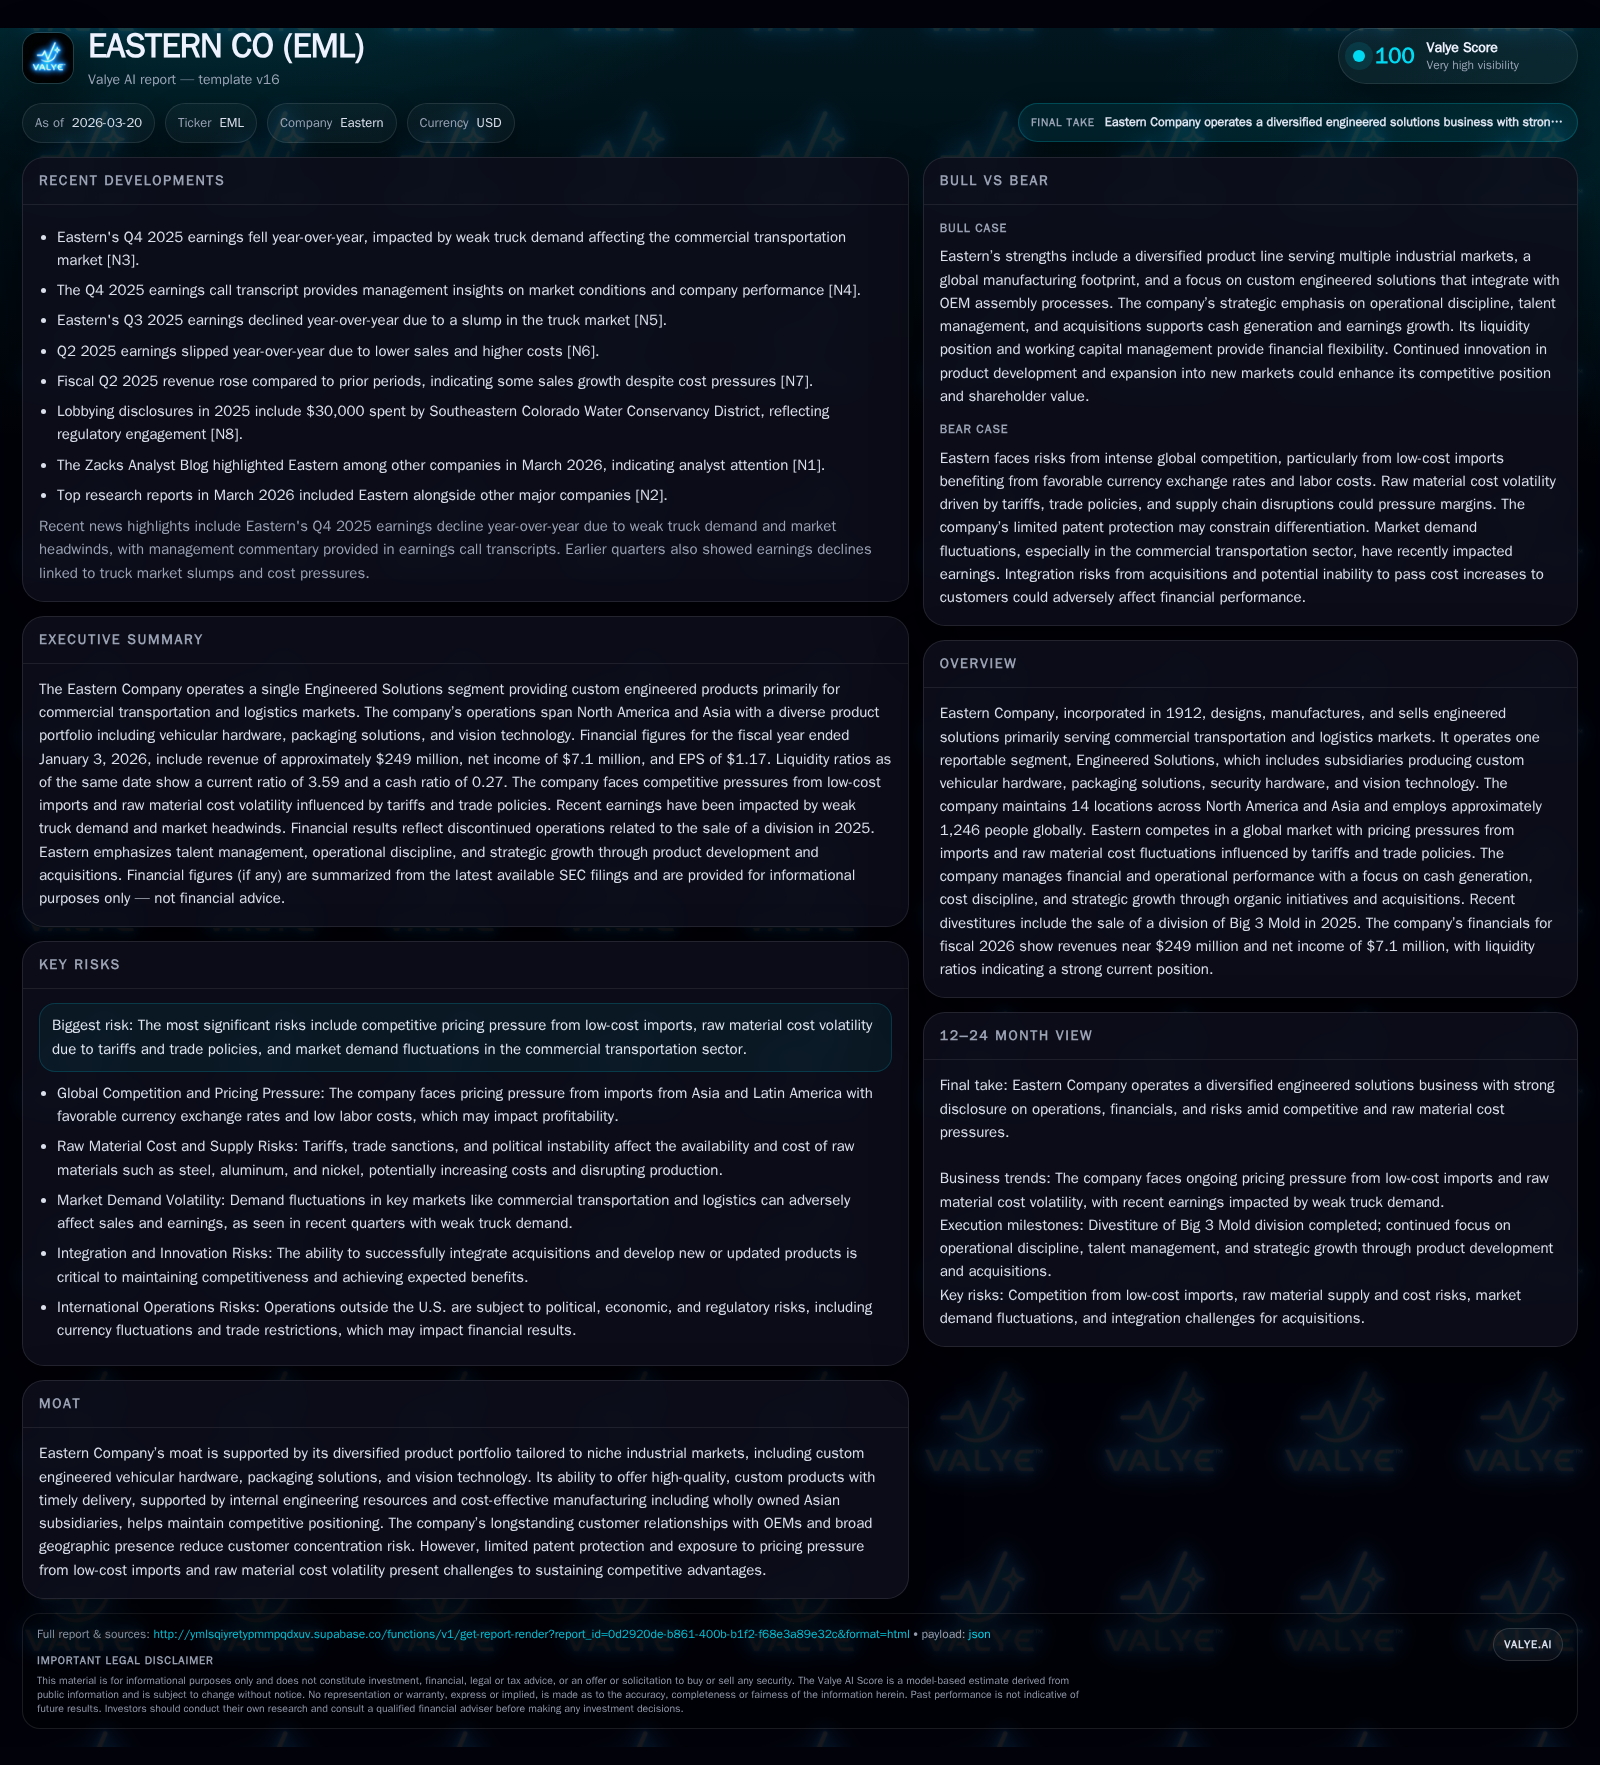
Eastern Company, a century-old manufacturer specializing in engineered vehicular hardware and niche industrial products, reported an 8.7% decline in revenue for fiscal 2026 accompanied by a 47% drop in operating income. Despite strong legacy operations and a diversified product portfolio supported by Asian manufacturing subsidiaries, the company faces persistent pricing pressures from low-cost imports and raw material cost volatility linked to trade policies. Recent strategic moves include divestitures such as the sale of its Big 3 Mold division and refinancing its debt to maintain liquidity. Going forward, the company's performance hinges on recovery in commercial transportation demand and effective management of capital structure constraints.
Century-Old Industrial Legacy Meets Contemporary Challenges
Founded more than a century ago in Connecticut, Eastern Company has sustained its industrial presence by focusing exclusively on Engineered Solutions serving commercial transportation and logistics markets [S1][F1]. This segment encompasses custom vehicular hardware, packaging solutions, security hardware, and vision technology manufactured across fourteen sites spanning North America and Asia. The company employs roughly 1,246 people worldwide, maintaining long-standing customer relationships with original equipment manufacturers (OEMs) that help reduce concentration risk [S1].
Eastern’s moat lies in its diversified product range tailored for niche industrial applications combined with internal engineering capabilities that enable custom solutions delivered promptly [S1]. Its wholly owned Asian subsidiaries help preserve cost competitiveness despite ongoing pressure from low-cost imported products flooding the market. However, limited patent protection restricts strong barriers from entrants, while price wars driven by imports remain an ongoing challenge.
Revenue and Operating Income Trends: Tracing the Steep Downturn
Financial performance during fiscal years 2022 through 2026 illustrates a clear inflection point where revenue and profitability deteriorated markedly [F1]. Revenues declined every year since FY2023 after peaking near $279 million in FY2022. FY2026 ended with $249 million representing an -8.7% revenue contraction year-over-year from fiscal 2025 levels [F1]. More pronounced was operating income slumping nearly half (47%) to about $10.7 million from over $20 million the prior year [F1]. Net income rebounded to $7.13 million due primarily to reversal of prior losses linked to discontinued operations such as Big 3 Mold divestitures affecting earlier years [F1].
Operating cash flow registered a significant drop (54%) accompanied by capex reduction exceeding 59%, showing tighter discretionary spending amidst uncertain market dynamics [F1]. This combination reflects acute margin compression from rising input costs coupled with sales volume declines.
Historical performance (annual)
| FY | Rev ($mm) | Net ($mm) | CFO ($mm) | OpInc ($mm) | Rev YoY | Net YoY |
|---|---|---|---|---|---|---|
| 2026 | 249 | 7 | 9 | 11 | ||
| 2024 | 273 | -9 | 19 | 20 | -0.3% | -199.4% |
| 2023 | 273 | 9 | 26 | 15 | -2.1% | -30.2% |
| 2022 | 279 | 12 | 7 | 14 |
Source: SEC companyfacts cache [F1].
Capital returns and efficiency (annual)
| FY | Div ($mm) | Buybacks ($mm) | FCF ($mm) |
|---|---|---|---|
| 2026 | 3 | 4 | 5 |
| 2024 | 3 | 3 | 10 |
| 2023 | 1 | 20 | |
| 2022 | 2 | 4 |
Source: SEC companyfacts cache [F1].
Table summarizes key annual financial metrics highlighting steep operational pressures emerging in FY2026.
Market and External Pressures Driving Performance Shifts
The principal markets served—commercial transportation and logistics—have experienced significant softness indicated by weakened truck orders reported during late fiscal periods [N1][N2]. Management cited sluggish end-market demand amid economic headwinds affecting fleet upgrades as a major driver behind lower sales volumes.
Additionally, pricing pressure is aggravated by imports predominantly from Asia benefiting from cheaper labor costs and favorable currency exchange rates that erode Eastern's pricing power [S1][N2]. These low-cost competitors leverage scale advantages that compel Eastern to maintain disciplined cost controls yet limit margin expansion potential.
Currency-driven volatility acts as a double-edged sword affecting both input costs and competitive selling prices amid fluctuating foreign exchange rates disadvantaging U.S.-based manufacturers even deploying offshore production capacities [S1].
Global Operations and Tariff-Induced Raw Material Cost Volatility
Eastern’s sourcing strategy includes domestic suppliers alongside affiliated subsidiaries based in Asia providing partial insulation against escalating raw material prices [S1]. However international trade policies create persistent volatility risks as tariffs fluctuate—impacting steel alloys and other key inputs critical for manufacturing vehicular hardware components [S23][S1].
Trade agreements carry requirements such as quotas and elevated customs duties that may delay shipments or increase landed costs [S1]. Supply chain disruptions including port congestion or container shortages amplify these challenges requiring alternative logistics arrangements often at higher expense.
The Asian manufacturing footprint offers operational leverage but remains vulnerable to geopolitical shifts such as trade sanctions or tightened export controls which could affect continuity or input pricing [S1]. Such exposure demands vigilant risk monitoring while balancing cost optimization efforts.
Assessing Eastern's Organic Growth Strategy and Recent Divestitures
In Q3 of fiscal year 2024 Eastern announced intentions to divest its Big 3 Mold division deemed non-core along with its ISBM tooling operations which were sold out in April 2025 [S1]. This move reorients resources towards core businesses better aligned with engineered vehicular hardware and adjacent industrial markets.
Management emphasizes prudent organic growth initiatives complemented selectively by acquisitions but stresses stringent financial discipline given current market headwinds [S1]. Divestitures enhance capital availability for reinvestment though also reduce total revenue base temporarily.
Such strategic pruning reflects an effort to consolidate into profitable niches where Eastern’s customization capabilities confer differentiation advantages against commoditized competitors.
Capital Structure Overhaul and Debt Facility Refinancing
Following multiple covenants adhered under the terminated TD Bank Credit Agreement—including a senior net leverage ratio cap of 3.5x—the company negotiated a new revolving facility worth $100 million over five years with Citizens Bank in October 2025 [S4][S5][S6][S10][S17].
Interest on this SOFR-based loan facility features tiered margins from approximately 1.375% upwards dependent on actual senior net leverage ratios maintained below threshold levels [S4][S10]. The credit line supports working capital needs while allowing optional prepayments without penalty enhancing financial flexibility during cyclical downturns.
Covenants also stipulate minimum fixed charge coverage ratios around three times interest expense reinforcing conservative leverage management suited for cyclical volatility exposure [S10][S18]. Compliance has been affirmed post-transition ensuring no events of default have arisen through recent reporting dates.
Cash Flows, Dividends, and Share Repurchase Commitments
Despite operational setbacks fiscal year cash flows proved adequate to sustain modest free cash flow approximating $4.9 million after deducting capex from operating cash flow [F1]. Capex reductions exceeding half compared to prior periods signal tightening of growth investments congruent with cautious budgeting.
Eastern maintained shareholder returns distributing dividends amounting to approximately $2.68 million alongside increased share repurchases totaling nearly $3.73 million in FY2026 facilitating capital return amidst shrinking profits [F1][S8][S14][S16]. Buyback programs initiated over a five-year horizon authorize up to several hundred thousand shares yet deploy at management discretion responsive to market conditions.
Continuity of dividend payments alongside active share repurchase illustrates commitment to balancing liquidity preservation with shareholder value enhancement despite broader industry cyclicality.
What Comes Next: Key Milestones and Market Indicators to Watch
Explicit guidance remains absent from recent commentary; however key industry watchers flag upcoming data points including truck order backlogs levels as leading indicators for recovery timing in commercial transportation related business [N2][N3].
Tariff developments or easing trade tensions between U.S., Asian regions could materially influence raw material costs directly impacting future margins disclosed under quarterly results cycles.
Monitoring cash flow trends relative to incremental business normalization will signal capacity for restoring growth investments or enhancing capital distributions heading into next fiscal cycles.
Investors should particularly observe company adherence to covenants within new credit arrangements amid fluctuating operational results as trigger points may influence financial flexibility or strategic initiatives going forward.
This analysis aims solely to present the factual context underlying Eastern Company's recent performance metrics derived chiefly from SEC filings and reputable market sources without expressing investment opinions or recommendations.
Disclaimer: This is research-only, informational analysis and not investment advice. It may include AI-generated interpretation and general industry context. Always verify important details using primary sources.

Comments