
Enerpac Tool Group Enhances Growth Capacity with $451M Acquisition and Credit Facility Expansion
Enerpac advances its industrial tooling platform through strategic acquisition and improved liquidity amid ongoing margin pressures.
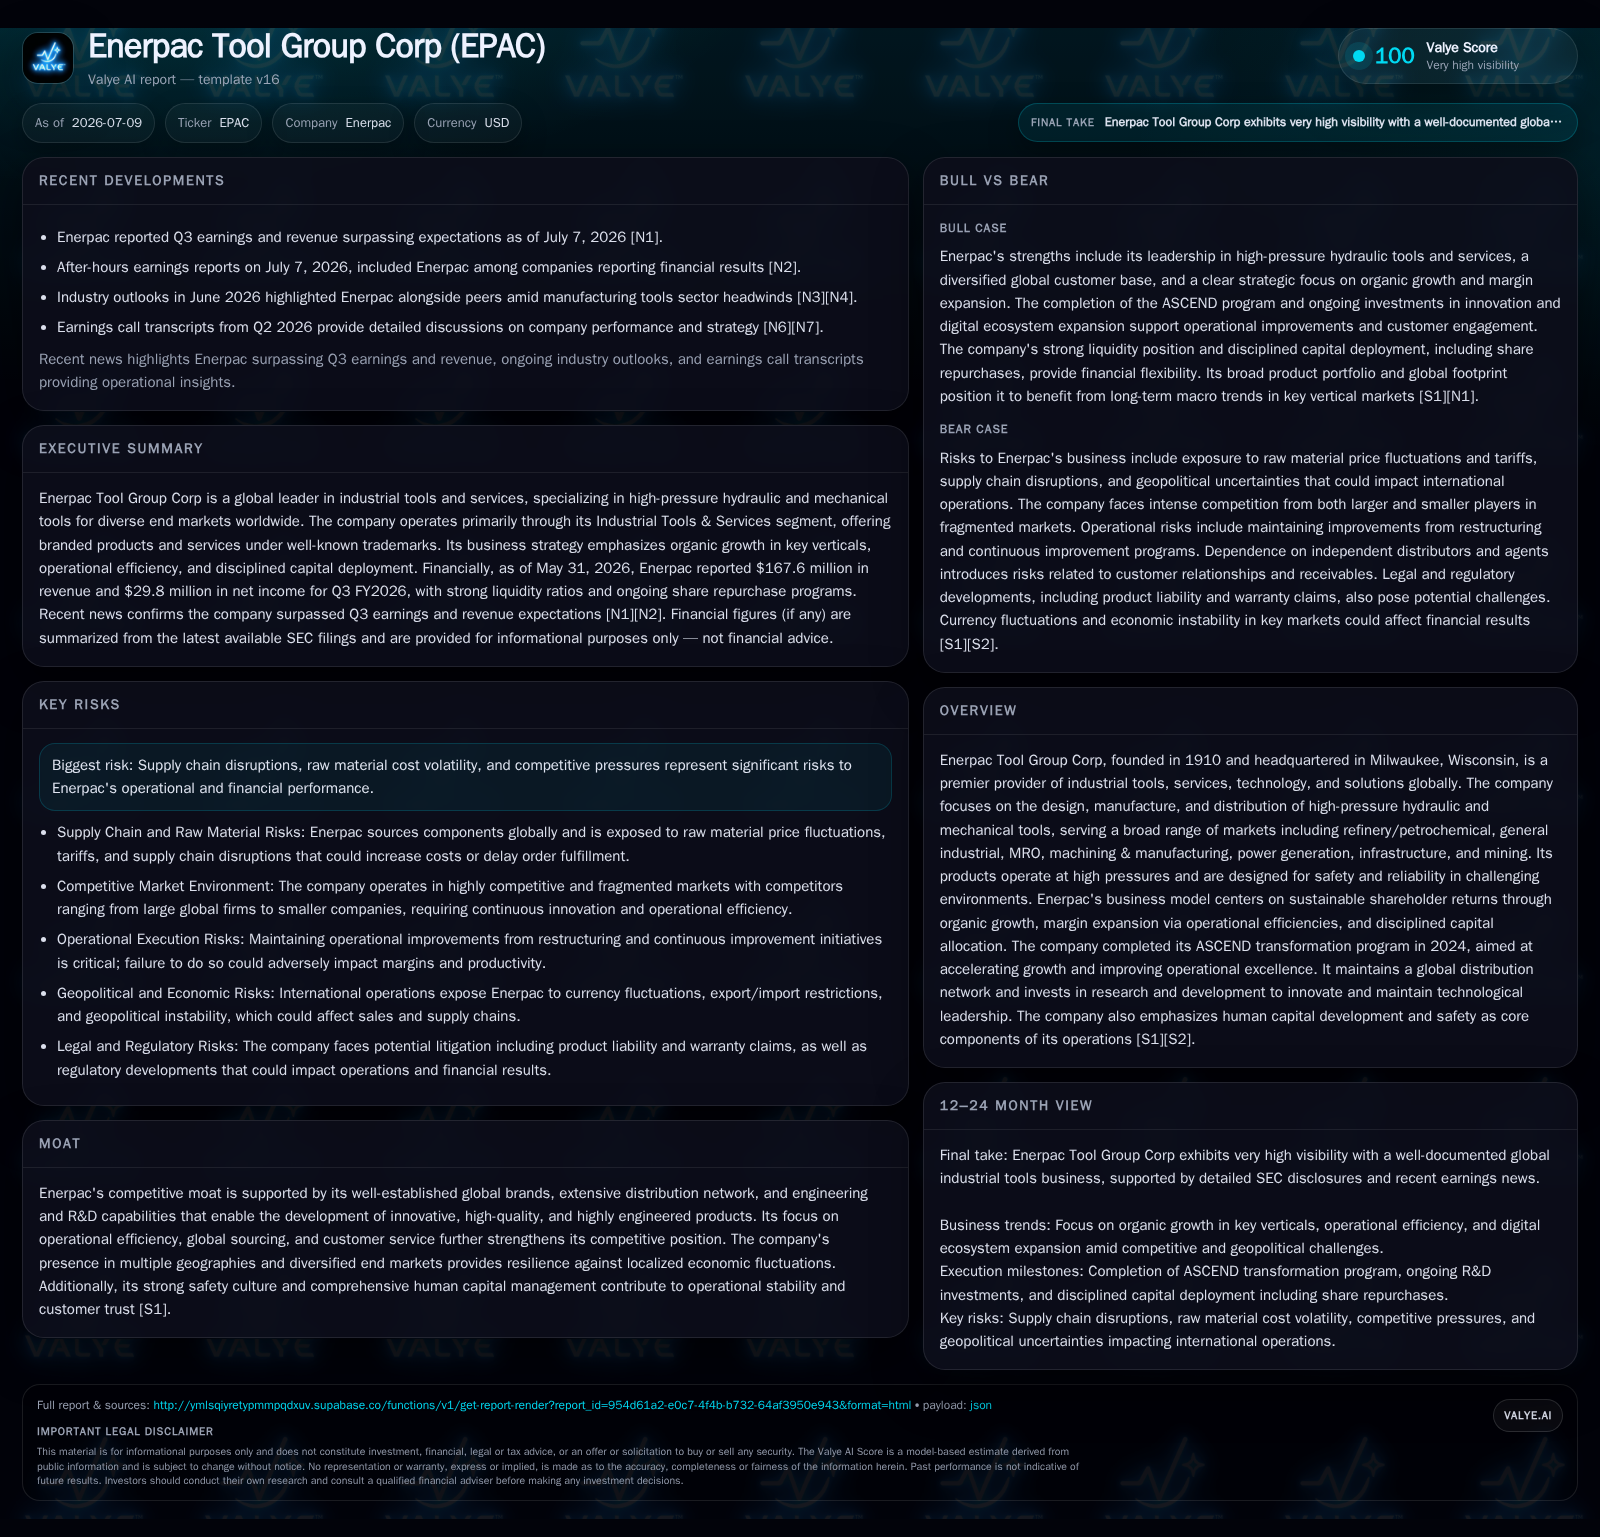
Enerpac Tool Group reported steady operational progress in Q3 FY2026 with product sales growth offset by declines in services mainly in the UK. The company completed its ASCEND transformation to boost operational efficiency and recently amended its credit facility to increase revolving capacity from $400 million to $625 million, underpinning a $451 million cash acquisition of Specialized Fabrication Equipment Group. Enerpac maintains strong global brand presence and diversified end markets but faces risks from supply chain volatility, tariff costs, and competitive pressures. Going forward, integration of the SFE Group and sustained margin expansion via operational leverage will be key to deliver on growth expectations [S2][S3][S1].
Recent Operating Update
Gross margin experienced contraction as tariff-driven cost inflation flowed through cost of goods sold, compounded by service segment softness [S1][S14]. Operating profit correspondingly dipped compared to prior periods despite intact SG&A discipline. However, management reinforced that the ASCEND transformation program completed at the end of fiscal 2024 continues yielding operational efficiencies through Lean manufacturing principles and consolidated shared services models aimed at sustaining margin expansion against inflationary pressures
A significant liquidity enhancement was announced via a July 7, 2026 amendment to the senior credit facility that increased the revolving line from $400 million to $625 million [S2][S3][S24]. This adjustment provides Enerpac with substantial additional borrowing capacity ahead of a $451 million cash acquisition (plus equity considerations for key personnel) of Specialized Fabrication Equipment Group LLC ("SFE Group"), announced concurrently. Integrating SFE Group is expected to broaden Enerpac's product offerings and geographical reach while feeding into its long-term growth strategy centered on industrial tool solutions
Business Model: Engineered Industrial Tools with Complementary Services
Enerpac operates principally within a single reportable segment: Industrial Tools & Services (IT&S). This segment designs, manufactures, and distributes branded hydraulic and mechanical tools engineered for high-pressure applications focused on precision heavy-lifting and positioning tasks critical in complex industrial environments spanning over 100 countries globally [S1]. The company’s technology caters primarily to customers in refinery/petrochemical, general industrial maintenance repair & operations (MRO), machining & manufacturing sectors, power generation projects, infrastructure construction, mining operations, among others.
Revenue is generated predominantly through sales of proprietary tools alongside value-added services including tool rental programs and maintenance support. Sales recognition occurs on transfer of control—typically upon shipment or installation—while services accrue based on contract terms or usage patterns. Gross margin variability arises from product mix shifts between higher-margin engineered tools versus lower-margin service components.
Operationally, Enerpac emphasizes continuous improvement initiatives such as Lean manufacturing methodologies targeting productivity gains and cost reduction. Selling expenses benefit from consolidation across geographies supported by a broad direct sales force augmented by an extensive distribution network. Adding digital ecosystem platforms enhances customer engagement by streamlining procurement cycles and enabling after-sale support services.
This business model benefits from high customer switching costs driven by product reliability requirements for safety-critical applications. Warranty coverage varies product-by-product but generally reflects rigorous quality standards with historical claim rates factored into prudent reserve accruals [S1][S2].
Industry Structure and Competitive Positioning
Enerpac navigates a specialized industrial tools landscape populated by diversified tooling manufacturers such as Stanley Black & Decker and Atlas Copco which also focus on hydraulic equipment segments. Its competitive differentiation centers on engineering excellence fostering high-performance products designed for hazardous operational environments requiring precision force control under extreme conditions.
The firm’s broad geographic footprint across developed markets ensures revenue stability with resilience against regional downturns while exposure to emerging markets like Asia Pacific offers incremental growth opportunities aided by infrastructure development demands. Its scale enables optimized global sourcing mitigating raw material cost volatility impacts better than smaller competitors.
Competition is influenced heavily by technological innovation cycles requiring sustained R&D investments influencing long-term market share shifts. Enerpac’s well-recognized brands coupled with robust after-sales services contribute toward solid customer retention rates—a critical KPI supporting recurring aftermarket revenue streams.
Growth Drivers
Key growth drivers include:
- Industrial Automation Demand: Increasing adoption of automation necessitating precise hydraulic tooling solutions.
- Infrastructure Expansion: Global infrastructure projects fuel need for heavy-lifting tooling across sectors including energy transmission.
- Maintenance Replacement Cycles: Regular MRO activities sustain demand for replacement parts and rented tooling assets.
- Product Innovation: Continued investment in R&D supports development of lighter-weight yet higher-force capacity tools enhancing competitive differentiation.
- Digital Ecosystem Integration: Leveraging digital platforms facilitates deeper customer penetration through enhanced service capabilities.
- Geographic Diversification: Emerging market penetration expands addressable market beyond mature regions.
- Strategic Acquisitions: The recent SFE Group deal exemplifies inorganic growth bolstering capabilities aligning with core competency areas.
Execution on these drivers will be monitored closely through KPIs such as organic revenue growth rates differentiated by product vs service lines, gross margin trends reflecting pricing power amid commodity headwinds, warranty claim frequency for quality assessment, rental utilization metrics signifying aftermarket engagement strength, R&D spend efficiency ratios relative to sales, and working capital turns highlighting inventory management effectiveness [S1][S2]
Risks and Watchpoints
Enerpac faces several operational risks including:
- Supply Chain Disruptions: Component shortages or freight delays can constrain fulfilment timelines impacting customer satisfaction.
- Raw Material Volatility: Fluctuating commodity prices directly affect production costs necessitating effective pricing strategies.
- Competitive Pressures: Rival firms continuously innovate potentially eroding market share if Enerpac fails to keep pace.
- Warranty Exposure: Incremental warranty claims could pressure reserves if products encounter unforeseen field failures.
- Currency Fluctuations: Global operations expose earnings to FX translation risks although partially mitigated using hedging instruments.
- Integration Challenges: Successful assimilation of SFE Group will require seamless management alignment without excessive synergy realization delays.
- Regulatory Compliance: Adhering to safety standards remains paramount given the critical nature of tool performance under hazardous conditions.
- Cyclical Demand Variability: End-market capital spending fluctuations linked to broader economic cycles could introduce volatility in order pipelines.
Observing trends around warranty reserve movements post-acquisition integration phases along with monitoring any strain on operating margins due to tariffs or inflationary input costs will be instrumental early indicators signaling risk materialization or mitigation effectiveness [S2][S25].
What to Watch Next
Stakeholders should track:
- Completion timeline and initial contribution metrics related to the SFE Group acquisition including revenue synergies or cost savings realized post-close.
- Updates on tariff impact mitigation strategies or raw material sourcing realignments announced during earnings calls or SEC disclosures.
- Quarterly organic sales momentum differentiated by major geographic zones particularly Asia Pacific market traction reports.
- Continuous improvement program deliverables translating into incremental operating margin expansions quarter over quarter.
- Warranty claim trends acting as proxies for sustained product quality control efforts amidst growing installed base volumes.
- Leverage ratio developments relative to credit facility covenants especially following recent revolver increment facilitating acquisition funding [S2][S3][N1]
Financial Profile Discussion
Enerpac’s balance sheet retains substantial liquidity with cash and equivalents totaling approximately $116 million at quarter-end May 31, 2026 alongside no borrowings drawn under the revolving credit facility which now stands expanded at $625 million availability [F1][S2]
Debt covenants remain comfortably met with net leverage well below maximum thresholds; interest coverage remains safely above minimum stipulated levels ensuring financial flexibility continues unhindered even as debt usage rises temporarily for strategic acquisitions [F1][S2]. The company's disciplined capital allocation emphasizes reinvestment into growth initiatives while maintaining conservative leverage ratios consistent with sector norms. Cash flow generation capability anchored on profitable growth plus working capital improvements continues driving positive free cash flow metrics sustaining this sound financial footing
This analysis incorporates information from recent filed quarterly and annual reports filed with the SEC as well as contemporaneous news coverage up to July 9, 2026. It aims to provide an informed perspective on Enerpac's operating environment without offering investment research views or price targets.
Disclaimer: This is research-only, informational analysis and not investment advice. It may include AI-generated interpretation and general industry context. Always verify important details using primary sources.

Comments