
Equinor ASA’s Strategic Momentum: Balancing Oil Production and Renewables Expansion
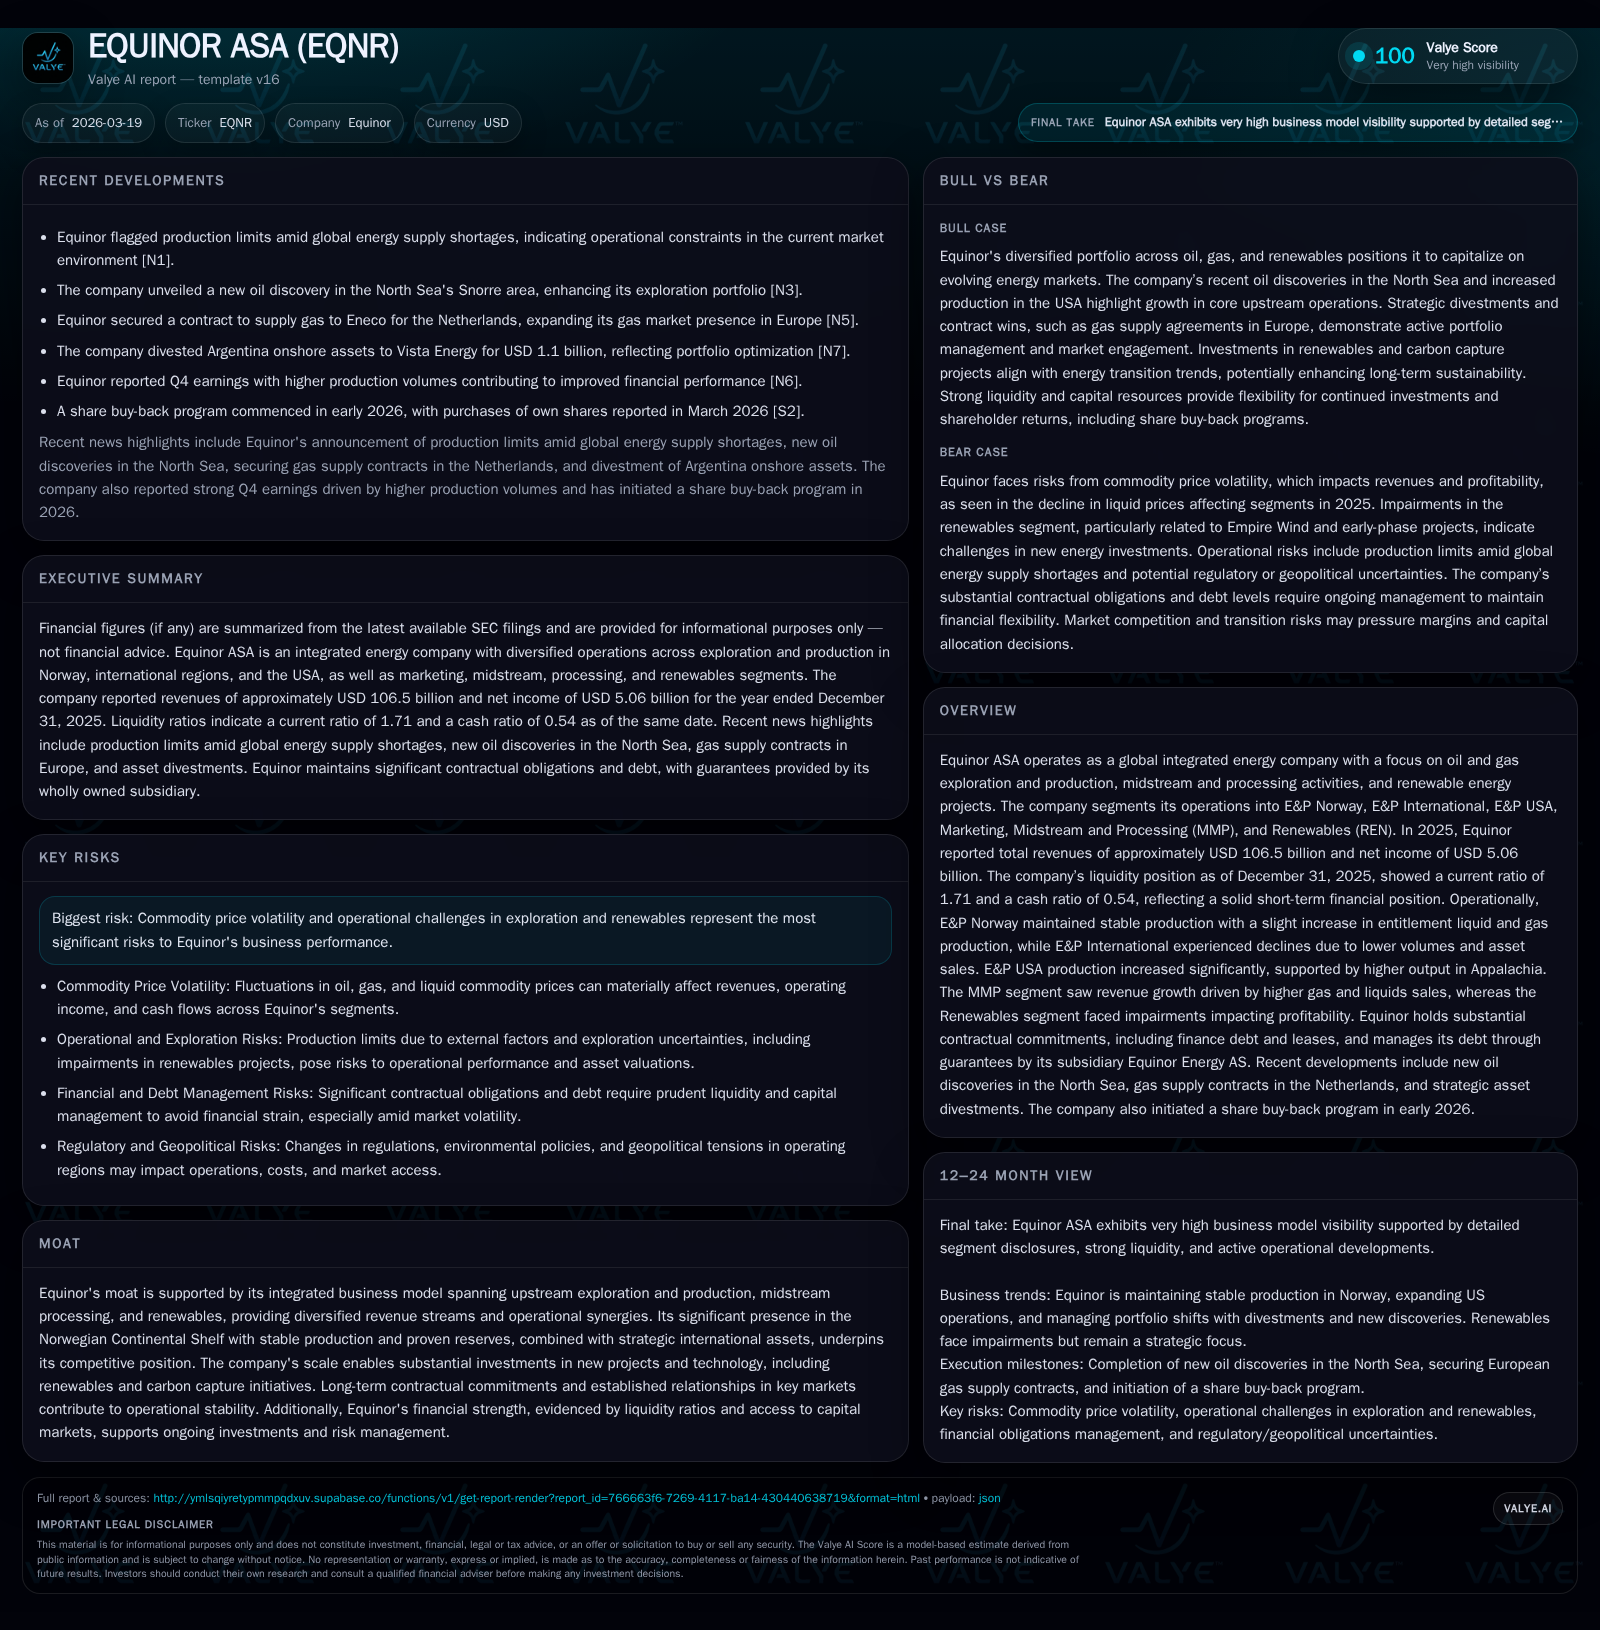
Equinor delivered solid 2025 revenue growth led by stable Norwegian production, while advancing renewable ambitions amid operational and capital allocation shifts.
In 2025, Equinor ASA achieved $106.5 billion in revenues, growing 2.6% year-over-year despite commodity price headwinds and segment-level production volatility. Growth in US Appalachia offset declines internationally, while the core Norwegian Continental Shelf segment maintained stable entitlement liquid and gas output. Asset divestments including a $1.1 billion Argentina onshore sale funded North Sea discoveries and renewables investments. Capital allocation balanced shareholder returns with increased capex focused on upstream developments and energy transition projects. Liquidity remained robust with a current ratio of 1.71 and an estimated return on equity near 12.5%. Looking ahead, key milestones include navigating global supply constraints, ramping new North Sea fields, and executing a nearly $2 billion share buyback program.
Strong 2025 Revenue Growth Anchored by Norway's Production Stability
Equinor posted total revenues of approximately USD 106.5 billion for calendar year 2025, reflecting a modest increase of 2.6% compared to USD 103.8 billion in 2024 [F1]. This topline advancement rested chiefly on the E&P Norway segment where entitlement liquid and gas production grew slightly by 2%, with liquids output rising 7% year-over-year to an average of 671 mboe/day [S1]. However, price dynamics presented a mixed picture: average liquids prices declined by roughly 13% to $66.8/bbl due to global crude market pressures, while internal gas prices improved by about 13% to $10.70/MMBtu [S1]. These factors collectively moderated revenue gains.
Historical performance (annual)
| FY | Rev ($bn) | Net ($bn) | Rev YoY | Net YoY |
|---|---|---|---|---|
| 2025 | 106.5 | 5.1 | +2.6% | -42.7% |
| 2024 | 103.8 | 8.8 | -3.2% | -25.8% |
| 2023 | 107.2 | 11.9 | -28.9% | -58.6% |
| 2022 | 150.8 | 28.7 |
Source: SEC companyfacts cache [F1].
Capital returns and efficiency (annual)
| FY | Div ($bn) | ROE% |
|---|---|---|
| 2025 | 3.8 | 12.5 |
| 2024 | 7.8 | 20.8 |
| 2023 | 10.8 | 24.5 |
| 2022 | 7.5 | 53.2 |
Source: SEC companyfacts cache [F1].
Operating expenses increased from USD 3.6 billion to USD 3.8 billion within Norway’s segment, driven primarily by administrative cost inflation tied to ownership restructurings (e.g., Petoro swap gains of USD 491 million), new field ramp-ups, cancellation fees related to electrification projects like Halten, plus currency translation headwinds from a weakening USD vs NOK [S1]. A significant reduction in Gassled removal obligations also lowered transportation costs in this segment for the year [S1]. Depreciation and net impairment charges rose sharply (+19%) partly attributable to the USD/NOK exchange rate impact and impairments totaling USD 173 million compared to a smaller charge in prior year [S1]. Exploration costs climbed moderately as well.
These operational nuances evidenced Equinor’s sustained cost discipline amid investments in mature asset stewardship with measured downside buffer against volatile hydrocarbon pricing.
Segment-Level Production Dynamics: Gains in US Offset International Declines
Breaking down production contributions reveals divergent segment trajectories [F1][S1][N1]. The E&P USA operations leveraged higher output predominantly from the Appalachian region where entitlement liquids and gas volumes surged significantly—mitigating pressure elsewhere.
Conversely, E&P International reported notable declines averaging a 10% drop in entitlement liquids and gas production versus prior year to about 234 mboe/day (down from 261 mboe/day), influenced by asset sales such as disposals in Azerbaijan and Nigeria throughout late 2024 and November 2025’s transfer of its Peregrino interest [S1][N13]. Further compounding volume effects were Production Sharing Agreement (PSA) adjustments that diminished recognized output [S1]. Commodity pricing headwinds accentuated revenue pressures given a roughly 14% fall in liquid price realizations for this segment.
Midstream operations (MMP) realized increased liquid sales (+10%) alongside natural gas volumes up by approximately 6%, boosted by elevated European pipeline gas prices hitting $12/MMBtu—a factor supporting stronger sales margins despite lower crude valuations [S14]. Renewables (REN) contributed ongoing investment-related impairments but maintained momentum with capacity expansions even as project execution faced supply chain constraints impacting rollout timing [S14][N4].
Strategic Asset Moves: Impact of Argentina Divestment and North Sea Discoveries
Portfolio optimization continued as a defining theme for capital redeployment [N13][N6][N7]. The divestiture of Argentine onshore fields for $1.1 billion exemplified Equinor’s shift toward higher-margin or strategically aligned assets with proceeds funneled into exploration upside fields closer to core Europe.
Recent hydrocarbon discoveries near Troll, Sleipner, and Snorre areas in the Norwegian North Sea not only replenish reserves but also underpin future production sustainability after the depletion curve maturity in older basins [N6][N7]. These new finds dovetail with Equinor's integrated strategy focusing upstream stability alongside mid/downstream processing synergies.
Taking advantage of Norwegian regulatory frameworks favorable to exploration advancements has enabled the company to balance international divestments with concentrated regional growth.
Renewables and Energy Transition: Ambitions Amid Operational Constraints
Equinor pursues rigorous transition goals integrating renewables growth, carbon capture projects, and gradual decarbonization guided by its comprehensive energy transition plan detailed in its latest filings [S1][N4]. However, the company signaled practical limitations related to global supply chain shortages restricting accelerations in renewables capacity addition during fiscal 2025.
Carbon capture initiatives similarly face technological scaling challenges reflected across the industry but benefit from dedicated governance through board oversight committees emphasizing risk-adjusted deployment [S1]. This prudent integration attempts alignment between ongoing fossil fuels cash flow generation with long-term cleaner energy investments—an evolution necessary for sustained competitive positioning within the sector.
Capital Allocation Priorities: Share Buybacks, Dividends, and Capex Focus
Equinor's capital management balanced shareholder returns with growth investments [F1][S3][N14]. Dividend payments contracted significantly from nearly $7.8 billion in 2024 down to $3.8 billion in 2025 amid net income declines (-42.7% YoY) yet maintained continuity reflecting cautious distribution policy aligned with earnings fluctuations [F1].
The company announced a sizable share repurchase program initiated February 2026 targeting purchases up to NOK 1.97 billion (~$190 million), intended for use primarily within employee incentive schemes rather than market-driven price support alone [S3][N14].
Capital expenditures climbed materially (+17%) particularly within E&P Norway where additions to PP&E exceeded $7 billion underscoring upstream development expansion alongside renewables spending mainly directed towards offshore wind farm projects despite impairment setbacks linked mainly to Empire Wind [S1][S14][S17]. This signals ongoing commitment towards maintaining asset base longevity while positioning for transition resilience.
Financial Health Metrics Illuminate Return on Equity and Liquidity Positions
Liquidity ratios remain supportive of operational flexibility: the current ratio stood at approximately 1.71 reflecting adequate short-term asset coverage over liabilities as per year-end December figures [F1],[S4],[S5],[S6]. Cash equivalents totaled circa $5 billion complemented by accessible financial investments enhancing buffer capabilities.
Net debt metrics illustrate controlled leverage with net debt-to-capital employed adjusted around mid-teens percent range providing room for strategic investment without undue balance sheet strain . Estimated return on equity hovered near a healthy ~12.5%, reflecting profitability levels tempered relative to historic peaks given macroeconomic volatility impacting net income [-42.7% YoY] though preserved capital base strength remains evident [F1],[S10],[S15].
The interplay between cash flow generation against capital spend outlays confirms Equinor’s disciplined financial stewardship enabling both organic growth financing as well as shareholder distributions when conditions permit [S19].
Outlook and Key Milestones to Monitor in 2026
Looking forward to the full year of 2026 several pivotal indicators warrant close observation:
- Production caps cited amid global energy supply constraints may temper volume growth expectations especially as geopolitical uncertainties persist affecting export flows; however planned commissioning phases for new North Sea facilities based on recent discoveries will be critical milestones validating reserve replacement efforts [N4][N6][N7]
- Execution progress on capital programs across upstream expansions and renewables deployments alongside performance monitoring of existing contracts such as recent gas supply agreements in Europe will influence operational trajectory [N12]
- The share buy-back program is set over multiple tranches extending into early 2027 providing insight into management’s confidence regarding availability of excess cash post-investment requirements [S3][N14]
- Commodity price volatility remains the foremost external risk factor deserving scrutiny influencing margins especially through impacts on liquids benchmarks which have historically been more volatile than gas pricing fundamentals [F1]
Overall, Equinor maintains strategic momentum balancing traditional oil & gas strengths with evolving renewable commitments amidst measured capital returns emphasizing adaptability within an increasingly complex energy sector landscape.
This analysis is prepared solely for informational purposes based on publicly available data including SEC filings ([F1], [S#]) and reputable news sources ([N#]). It does not constitute investment advice or recommendations.
Disclaimer: This is research-only, informational analysis and not investment advice. It may include AI-generated interpretation and general industry context. Always verify important details using primary sources.
Comments