
GasLog Partners LP's Volatile Revenue Cycle and Emerging Financial Challenges
A detailed review of GasLog Partners LP's recent financial volatility, liquidity pressures, and the implications for its capital deployment and growth trajectory.
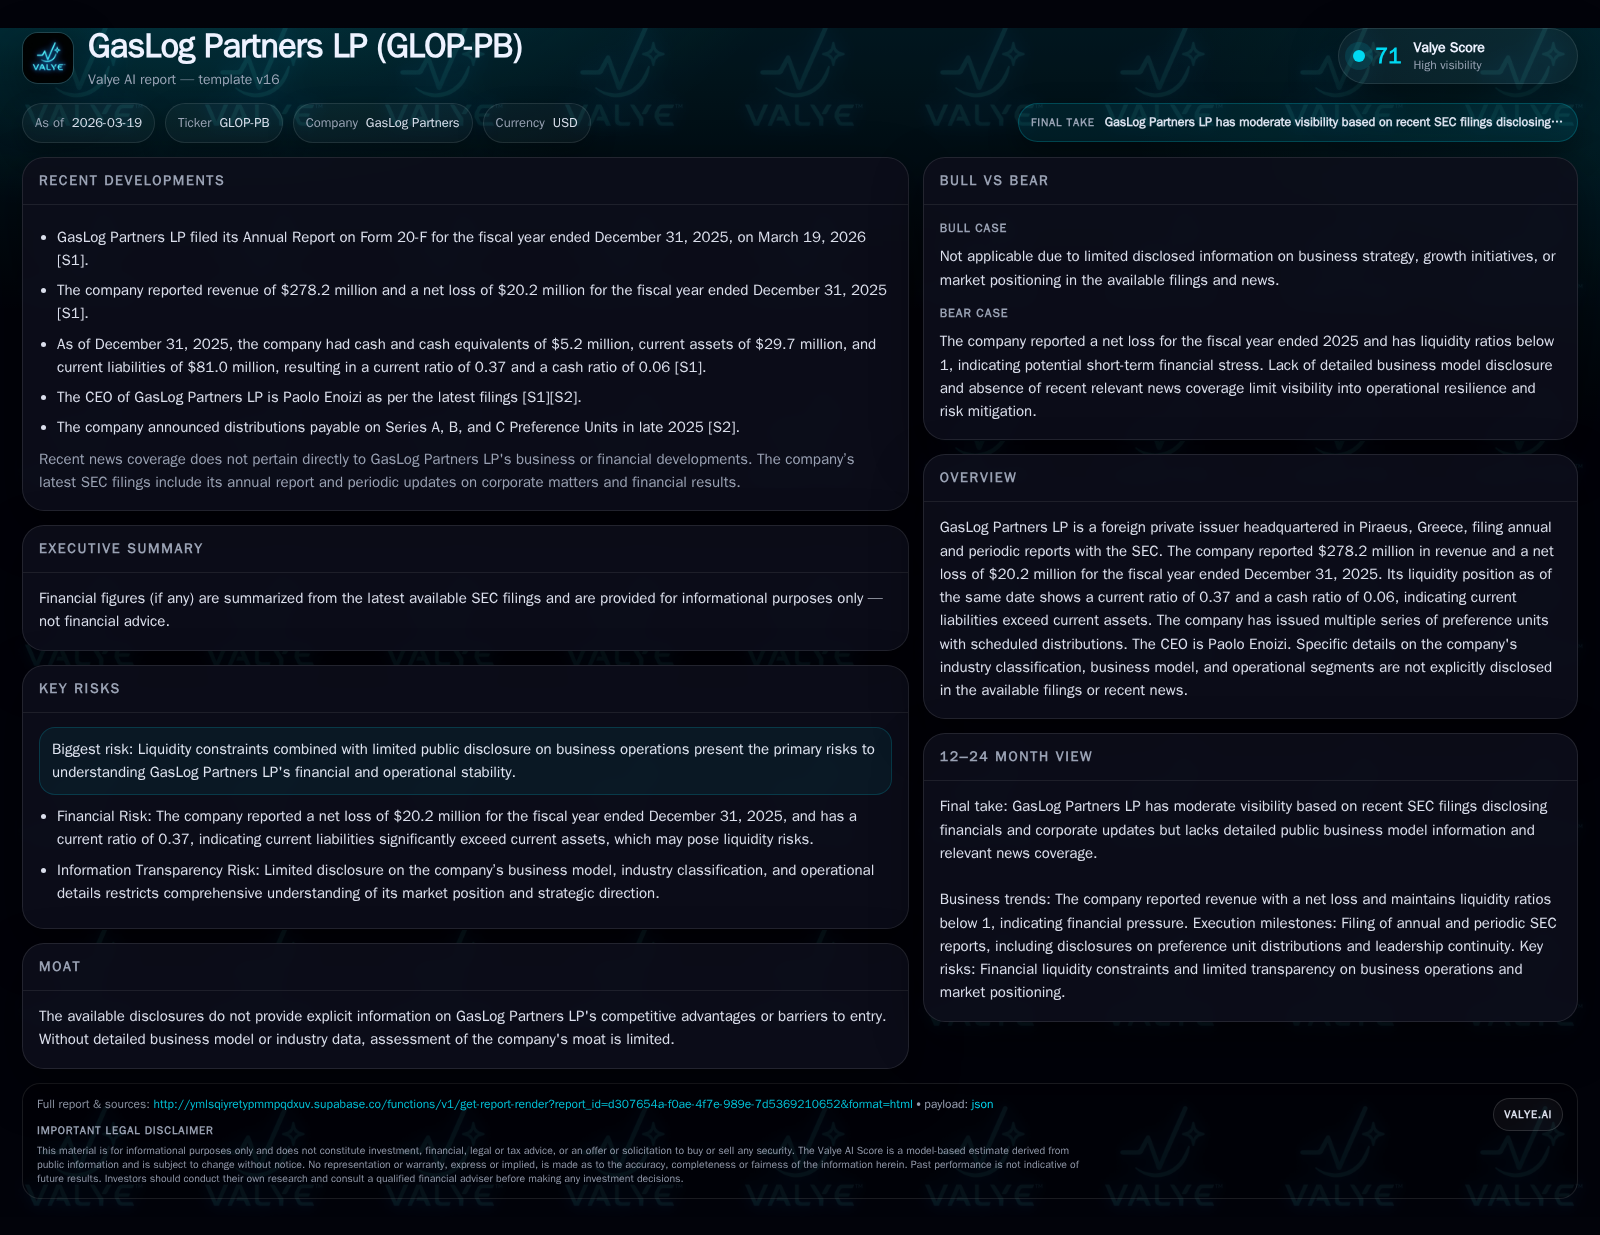
GasLog Partners LP experienced peak revenues near $398 million in FY2023 but faced a significant reversal by FY2025 with revenues declining over 21% year-over-year to $278.2 million and a net loss of $20.2 million. The partnership’s liquidity profile shows working capital deficits with a current ratio of 0.37 and limited cash reserves against substantial current liabilities. Preference unit distributions continue as mandatory obligations, constraining capital allocation flexibility amidst shrinking cash flows. Near-term growth visibility is limited given sparse guidance; key milestones include debt refinancing efforts and charter contract renewals.
Historical Performance Overview
GasLog Partners LP demonstrated robust revenue growth through FY2023, with revenues rising from approximately $371 million in FY2022 to nearly $398 million in FY2023, followed by a moderate decline to about $356 million in FY2024 [F1]. Concurrently, net income increased from $119 million in FY2022 to approximately $151 million in FY2024, reflecting favorable market conditions during this period [F1]. Equity grew from about $961 million at the end of FY2022 to over $1.52 billion at the end of FY2023 before moderating to roughly $1.30 billion by the end of FY2024 [F1].
FY2025 Financial Results and Challenges
FY2025 marked a significant reversal with revenues declining by 21.9% year-over-year to $278.2 million and the company recording a net loss of approximately $20.15 million [F1]. This downturn coincides with industry-wide headwinds affecting LNG shipping charters and utilization rates [S2][S3]. Equity decreased accordingly to about $1.09 billion by the end of 2025, reflecting accumulated losses [F1].
Liquidity and Capital Structure
At December 31, 2025, GasLog Partners reported current assets of approximately $29.7 million versus current liabilities exceeding $81 million, resulting in a current ratio of 0.37 [F1]. Cash and equivalents stood at just over $5.2 million, indicating a cash ratio near 0.06 [F1]. These metrics underscore working capital pressure and limited immediate liquidity buffers.
The partnership maintains multiple series of preference units with contractual distribution obligations that impact cash flow availability [S4][S5][S6][S7]. Credit facilities include covenants requiring prudent liquidity management given the current ratio below one.
Dividend Payments and Capital Allocation
Dividend payments declined sharply from around $292 million in FY2023 to approximately $130 million in FY2025, consistent with reduced distributable cash flow amid challenging market conditions [F1]. Preference unit distributions remain prioritized commitments, restricting flexibility for discretionary capital uses such as share repurchases or expansion investments [S10].
Operational Visibility and Outlook
GasLog Partners provides limited forward-looking guidance; management commentary suggests focus on contract renewals and fleet optimization amid volatile LNG demand dynamics [N2][S2][S3]. No specific data on charter backlog duration or terms are disclosed, limiting revenue visibility beyond the near term.
Risk Oversight and Governance
Governance structures highlight cybersecurity risk management overseen by an IT steering committee including CEO-level participation, aligned with industry standards for digital resilience [S1]. However, detailed disclosures on operational risks or market mitigation strategies remain sparse.
Strategic Considerations and Watchpoints
Absent evidence of share repurchases or significant capital expenditures recently, the company appears focused on meeting debt service and preference unit distribution obligations under constrained free cash flow conditions [F1][S10]. Upcoming refinancing activities related to credit facilities and outcomes of charter renewal negotiations are critical near-term milestones impacting financial stability [S3][N2].
Historical Financial Summary (USD millions)
Historical performance (annual)
| FY | Rev ($mm) | Net ($mm) | Rev YoY | Net YoY |
|---|---|---|---|---|
| 2025 | 278 | -20 | -21.9% | -113.4% |
| 2024 | 356 | 151 | -10.5% | +8.8% |
| 2023 | 398 | 139 | +7.2% | +16.6% |
| 2022 | 371 | 119 |
Source: SEC companyfacts cache [F1].
Capital returns and efficiency (annual)
| FY | Div ($mm) | ROE% |
|---|---|---|
| 2025 | 130 | -1.8 |
| 2024 | 226 | 11.6 |
| 2023 | 292 | 9.1 |
| 2022 | 29 | 12.4 |
Source: SEC companyfacts cache [F1].
Source: SEC filings summarized from [F1], [S1]-[S10]
Disclaimer: This analysis is based solely on publicly available data including SEC filings and recent company communications as cited. It does not constitute investment advice nor recommendations; readers should conduct their own due diligence.
Disclaimer: This is research-only, informational analysis and not investment advice. It may include AI-generated interpretation and general industry context. Always verify important details using primary sources.
Comments