
Mastech Digital's Revenue Plateau and Strategic Renewal
Despite a leveling of revenue growth and near break-even operating income, Mastech Digital leverages its dual focus on IT staffing and data analytics to seek new growth avenues while managing client concentration and seasonality risks.
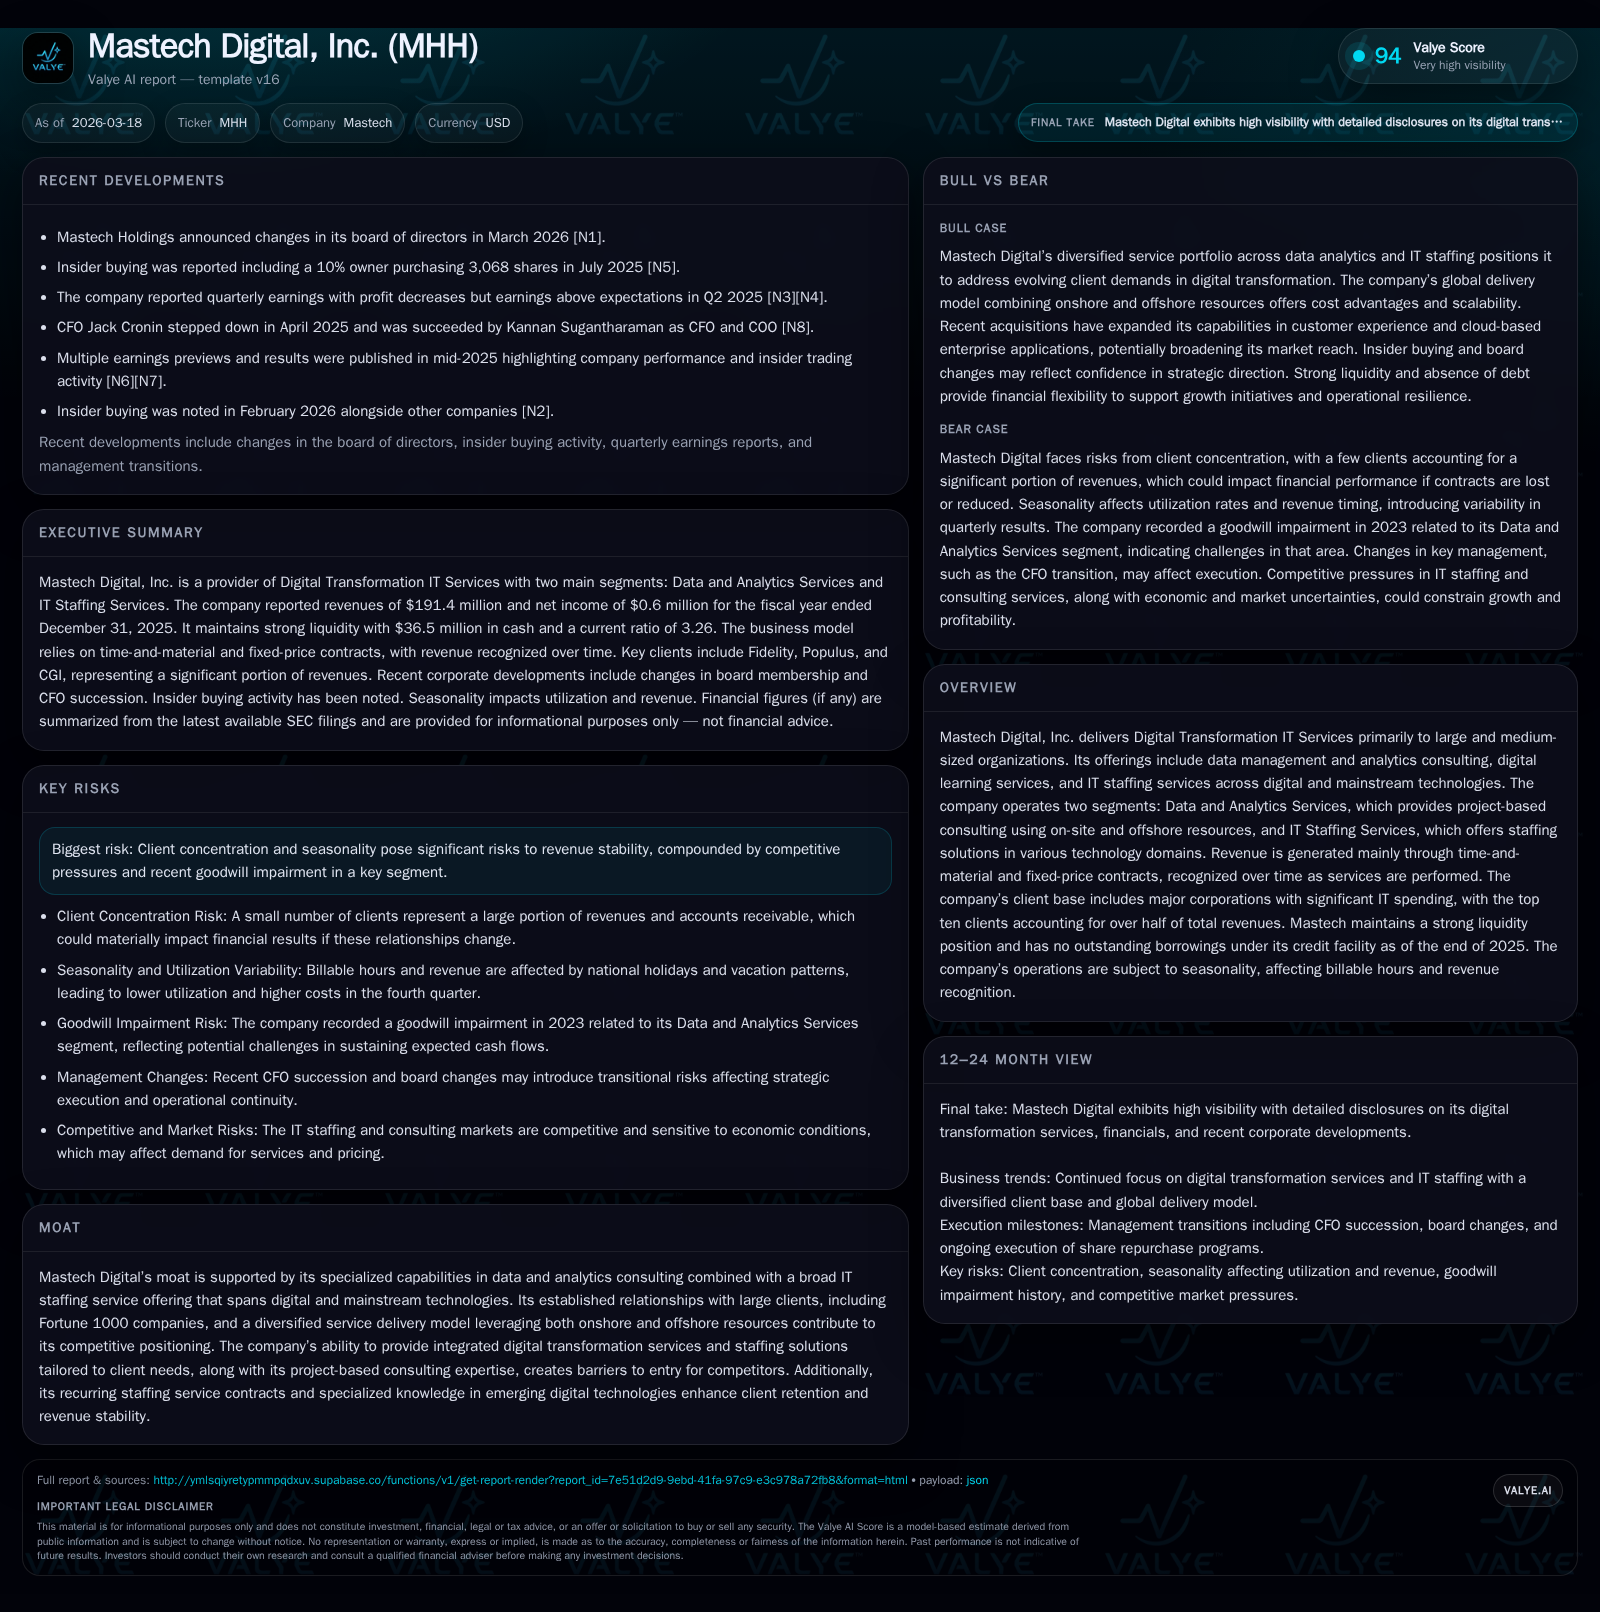
Mastech Digital, Inc. has experienced a significant revenue decline since FY2022, stabilizing at about $191 million in FY2025 with an operating income hovering near zero. The company’s two main segments—Data and Analytics Services and IT Staffing Services—face differing growth dynamics amid client concentration and seasonal headwinds. Strong liquidity, absence of debt, and an active share repurchase program reflect prudent capital management. Future catalysts include expansions in project-based consulting and management’s insider buying, although risks related to revenue seasonality and customer dependence persist. Monitoring operational margins post-seasonal troughs alongside contract wins will be critical in assessing sustainable growth.
Historical Revenue Trends and Profitability Drivers
Mastech Digital's financial trajectory over the past four fiscal years reveals a pronounced contraction in revenues accompanied by significant volatility in profitability. In FY2022, the company achieved revenues of approximately $242.2 million but saw this figure decline by 18% to about $201.1 million in FY2023, followed by further easing to $198.9 million in FY2024 and down again to $191.4 million in FY2025 — a cumulative 21% decrease over the period [F1]. The year-over-year revenue change slowed to a -3.8% decline between FY2024 and FY2025.
Operating income similarly demonstrated marked swings: from a robust $12.2 million profit in FY2022, Mastech slipped into a substantial loss of $9.3 million in FY2023 before partial recovery to $3.8 million profit in FY2024, narrowing almost entirely to break-even at $1.0 million in FY2025 [F1]. Likewise, net income followed this trend, dipping from positive gains ($8.7 million) through deep losses (-$7.1 million) back near breakeven ($0.6 million) most recently.
The stark fluctuations derive partly from changing project mixes within the Data and Analytics segment coupled with the inherent seasonality affecting consultant billable hours detailed below [S1], [S2]. These patterns reflect impacts from assignment completions near calendar year-end reducing both utilization rates and gross profits primarily into the subsequent quarter.
Historical performance (annual)
| FY | Rev ($mm) | Net ($mm) | CFO ($mm) | OpInc ($mm) | Rev YoY | Net YoY |
|---|---|---|---|---|---|---|
| 2025 | 191 | 1 | 11 | 0 | -3.8% | -82.1% |
| 2024 | 199 | 3 | 7 | 4 | -1.1% | +147.7% |
| 2023 | 201 | -7 | 16 | -9 | -17.0% | -181.9% |
| 2022 | 242 | 9 | 13 | 12 |
Source: SEC companyfacts cache [F1].
Capital returns and efficiency (annual)
| FY | Buybacks ($mm) | FCF ($mm) | ROE% |
|---|---|---|---|
| 2025 | 2 | 11 | 0.7 |
| 2024 | 0 | 6 | 3.9 |
| 2023 | 1 | 16 | -8.8 |
| 2022 | 12 | 10.1 |
Source: SEC companyfacts cache [F1].
Segment Contributions: Data & Analytics Versus IT Staffing
Mastech Digital reports under two primary operating segments: Data and Analytics Services (DAS) and IT Staffing Services (ITS) [S9], [S12]. In FY2025, DAS contributed roughly $33.3 million or about 17% of total revenues while ITS accounted for the balance of approximately $158.1 million (83%) [F1]. This split mirrors historical trends emphasizing staffing's prominence as the core revenue driver.
From a contract type standpoint, both segments primarily operate under time-and-material contracts where billing tracks consultant hours expended plus reimbursable expenses totaling less than 2% typically [S1]. DAS also includes fixed-price projects recognized via cost-based input methods reflecting progress towards completion [S1].
Gross margin analysis shows DAS delivering substantially higher profitability at roughly 46%, compared with ITS’s roughly 24% gross margin level, indicating the consulting nature of DAS brings greater per-project value despite its smaller scale [S22].
Client concentration remains material; the top ten clients represented approximately 58% of total revenues for FY2025 with Fidelity representing around 16.7%, Populus at about 12%, and CGI close to 11%. This concentration elevates revenue volatility risk with respect to contract renewals or spend variability [S12], further compounded by seasonal fluctuations due to holiday scheduling impacting consultant utilization [S1], [S2].
Offshore resource leverage notably supports DAS delivery workflows from Chennai, India alongside on-site client teams across North America and Europe — a sector-native approach balancing cost efficiency against proximity requirements for project management [S9]. ITS services employ domestic recruiting hubs combined with digital learning initiatives that blend fixed price components more selectively.
Operational Constraints: Seasonality, Client Concentration, and Margin Pressure
Seasonality constitutes a critical operational constraint per risk disclosures [S1], [S16]. Utilization rates among consultants dip during the fourth quarter coinciding with national holidays and vacation periods; subsequent contract completions often depress Q1 performances due to pipeline timing shifts.
Goodwill impairment recorded previously related to DAS totaling $5.3 million during FY2023 underscores pressure within this segment amid evolving customer demand dynamics [S9]. Competitive intensity within staffing markets adds margin pressure as wage inflation transmits indirectly via increased benefit costs during low-utilization periods [S1].
Management must navigate fluctuations requiring rigorous project mix adjustment alongside cost controls concentrated on severance liabilities totaling over $2 million currently stemming from executive transitions between late-2024 and early-2025 [S25]. These serve as one-time but material impacts on expense base.
Capital Structure and Liquidity Snapshot
A hallmark of Mastech’s recent financial posture is its clean capital structure accompanied by strong liquidity [F1], [S4], [S5], [S7]. The company carries no outstanding borrowings against its revolver as of December 31, 2025 — despite having an available capacity near $20 million — after retiring all term loan balances in early January 2023 following excess cash prepayments made during mid-2022 (totaling approximately $7.6 million) [S4].
Cash and cash equivalents stood at a robust $36.5 million at fiscal year-end providing ample working capital cushion amid cyclical headwinds [F1], while current ratio approximated a healthy ~3.26x suggesting short-term obligations remain comfortably covered [F1].
Office footprint management remains prudent; Mastech recently entered into a new five-year lease agreement commencing August 2026 for Dallas office space indicating expansion efforts consistent with strategic renewal objectives rather than contraction [S3]. Leases across other locations total around ~94k sq ft anchoring sales, recruitment, delivery operations primarily across North America.
Shareholder Returns: Buybacks, Dividends, and ROE Analysis
Capital allocation choices underscore a preference toward share repurchases rather than dividends; no dividends have been declared since suspension post-2014 per filings reviewed [F1], [S6]. Buyback expenditures accelerated substantially during FY2025 reaching nearly $2.25 million compared with just $80k repurchased during FY2024 — demonstrating heightened commitment towards returning capital amid muted earnings growth [F1], [N1], [S6].
Treasury stock holdings have climbed accordingly reaching roughly two million shares costing about $7.13 million at end-2025 reflecting ongoing treasury stock accumulation programs approved through February 2026 cycle expiration dates but renewed shortly thereafter for an additional up-to-$5 million authorization announced February ’26 [S14], [S15].
Reflecting constrained profit levels relative to equity (roughly $89 million), Mastech’s calculated return on equity (ROE) trails modestly around ~0.7%, signaling subdued overall returns driven chiefly by near break-even net income performance last fiscal year despite steady cash flow generation exceeding capex by more than tenfold ($11M CFO vs ~$0.38M capex) supporting strong free cash flow conversion ratios characteristic of service firms leveraging human capital assets efficiently without heavy fixed asset demands [F1].
Forward-Looking Signals and Potential Catalysts
While explicit quantitative guidance remains absent from filings or news releases ([N#],[S#]), several qualitative signs warrant attention going forward:
- Insider buying activity reported early-February ’26 marks potential managerial confidence suggesting viewed undervaluation or positive trajectory perceptions entering CY2026 amidst tactical shifts or contract pipeline maturation ([N2]).
- New Dallas office lease highlights possible scaling initiatives perhaps tied to expanding data analytics consulting capabilities or increased staffing coordination efforts into southern U.S markets ([S3]).
- Revised segment reporting plans aimed at closer metric alignment by operating decision makers could improve resource deployment effectiveness aligning strategy execution tightly ([S9]). Monitoring margin sustainability especially post-Q4/Q1 seasonal troughs along with emerging fixed-price contract contributions within Data & Analytics will offer tangible indicators of resilience or inflection points.
Key Risks Impacting Sustainability and Growth
Risks detailed predominantly center on client concentration—with top ten customers exceeding half total revenues positing major dependency vulnerability—and seasonal earnings volatility rooted historically in supply chain patterns influencing consultant activity cadence ([F1],[S9],[S16]). Such dynamics complicate forecasting confidence while exposing margins to heightened cyclicality.
Inflationary pressures indirectly inflate payroll-related expenses already evident through benefit cost escalations intensifying during low-utilization periods as consultants’ billable hours taper off around holidays ([S1]). Recent goodwill impairment charges underscore challenges faced within evolving competitive landscapes particularly affecting Data & Analytics segment’s profitability outlook ([S9]). Efforts focused on diversifying client base breadth potentially through deeper penetration into recurring staffing engagements or cross-selling integrated digital transformation solutions remain vital strategic mitigants.
This analysis synthesizes publicly available regulatory filings and news sources up through March 18, 2026 concerning Mastech Digital, Inc., presenting an overview grounded strictly on disclosed data without extrapolation or subjective valuation assessments.
Disclaimer: This is research-only, informational analysis and not investment advice. It may include AI-generated interpretation and general industry context. Always verify important details using primary sources.
Comments