
NextPlat Corp’s Dual-Sector Challenge: Cash Flow and Platform Progress Under Pressure
Q2 2026 filings reveal improved cash management offset by healthcare revenue softness amid ongoing platform and acquisition investments.
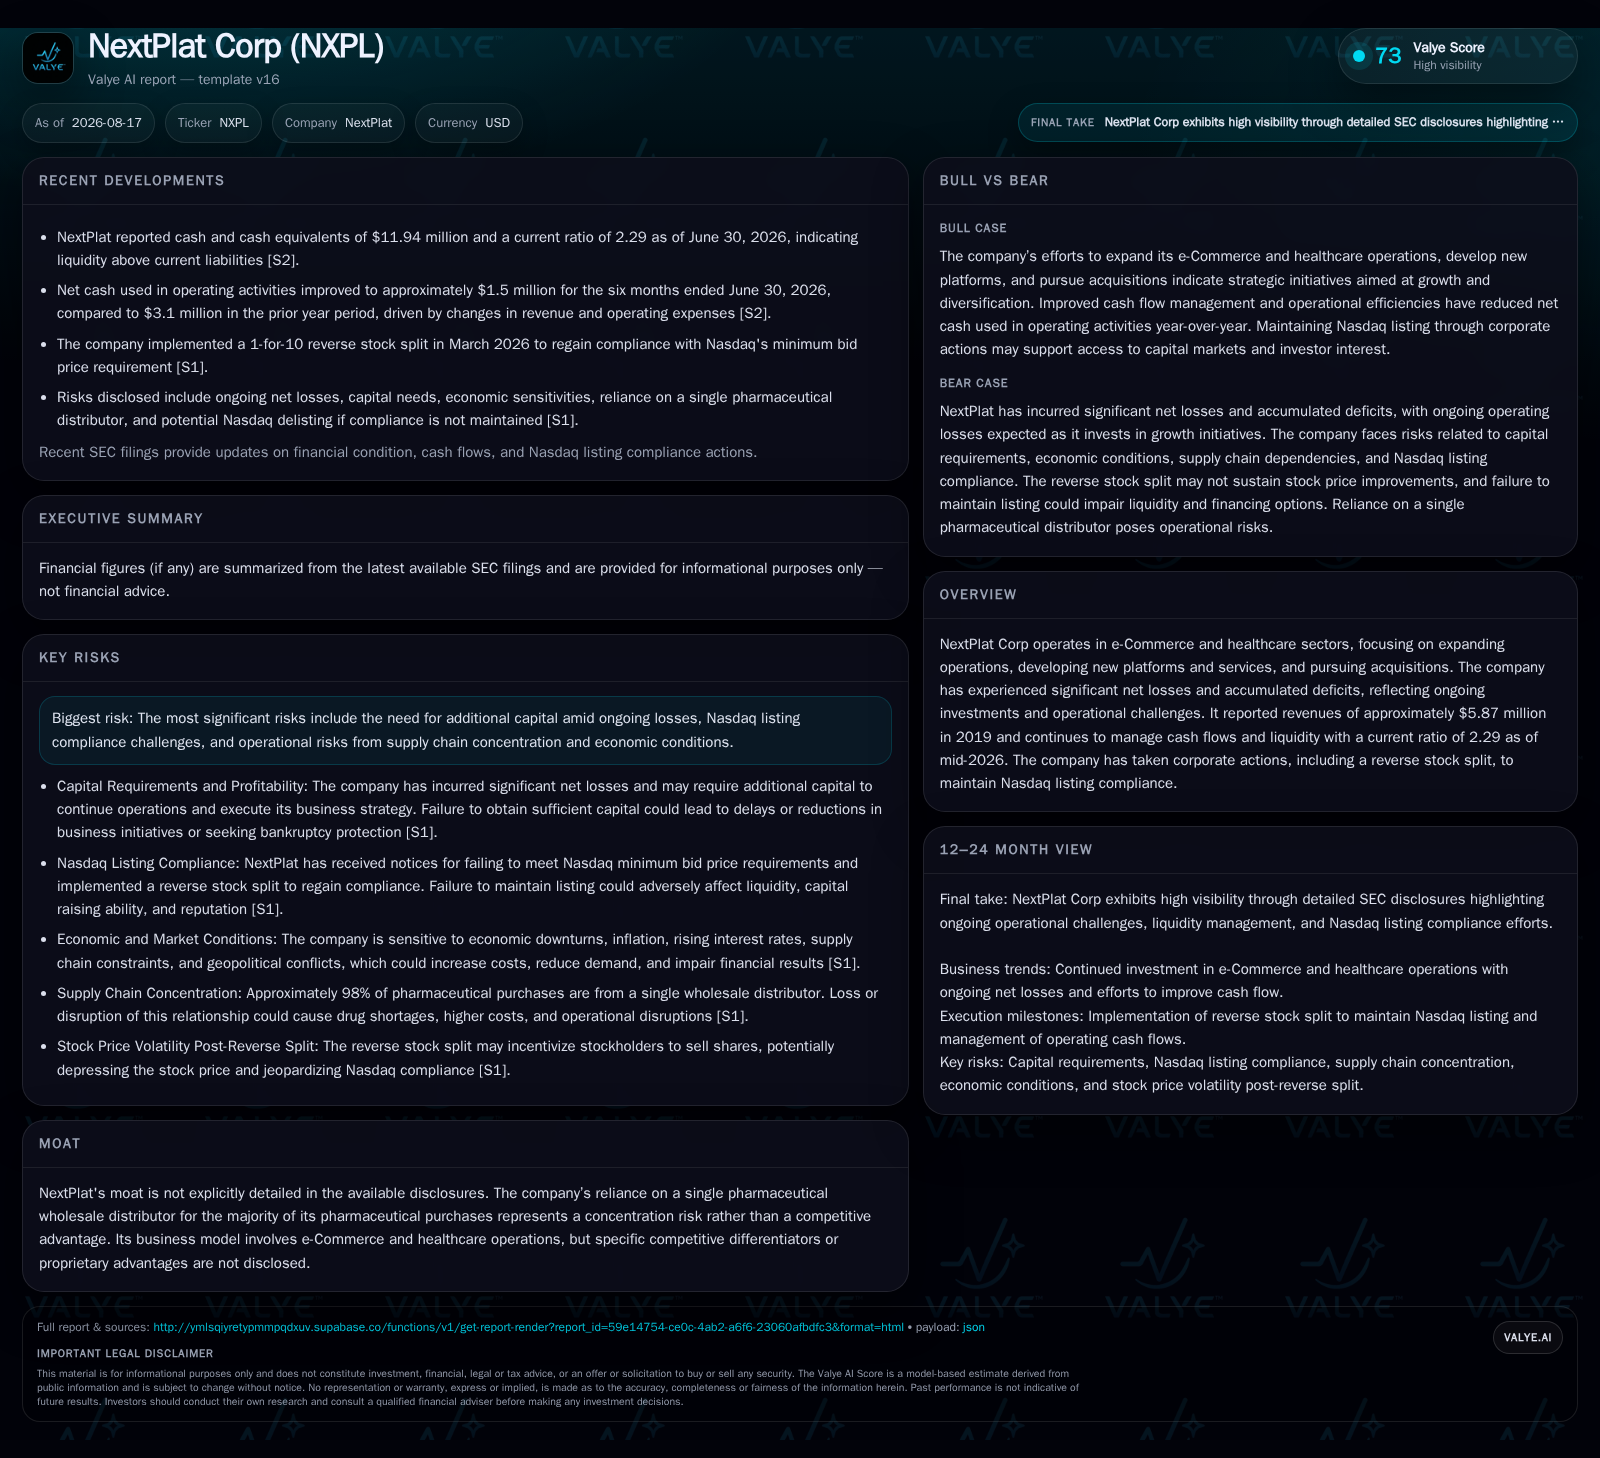
NextPlat Corp’s latest quarterly results showcase a meaningful reduction in operating cash outflows driven primarily by decreased inventory purchases and lower healthcare receipts. However, the company faces persistent challenges from declining healthcare revenues and supply chain concentration risks due to reliance on a single pharmaceutical distributor. While platform development and cost reductions have eased liquidity pressures, ongoing net losses and acquisition-related complexities underscore the need for continued capital access. NextPlat's dual focus on global e-Commerce for satellite communications products and healthcare services positions it at a challenging intersection where operational scale, regulatory compliance, and working capital intensity must be carefully balanced.
Q2 Operating Dynamics Reveal Improving Cash Usage vs. Healthcare Revenue Softness
NextPlat's Q2 2026 financial disclosure highlights a nuanced operational shift characterized by markedly improved cash consumption yet sustained healthcare revenue challenges. Specifically, cash paid for inventory purchases and related costs fell by about $5.4 million compared to the prior period while cash inflows from healthcare operations declined by approximately $5.6 million due to both lower revenues and timing delays in receivable collections [S2]. This interplay between reduced outflows for inventory—likely reflecting more cautious procurement or inventory optimization—and diminished inflows from healthcare segment underscores the company’s ongoing struggle to balance working capital demands amid sector headwinds.
The improvement in operating cash outflows narrowed net cash used in operating activities to roughly $1.5 million for the first half of 2026 versus $3.1 million in the same period last year, indicating relief in near-term liquidity pressures though not profitability [S2]. Decreases in payroll expenses owing to executive pay cuts and lower headcount further contributed to this trend alongside reduced non-recurring costs related to litigation and merger activities. The coherence of these changes reveals managerial efforts toward tighter expense control even as top-line challenges persist.
Dual-Segment Revenue Model Highlights Supply Chain Dependence and Regulatory Exposure
NextPlat operates two primary segments: e-Commerce distribution of satellite communication equipment worldwide and Healthcare Operations encompassing pharmacy services and drug distribution largely through Progressive Care LLC [S1]. The e-Commerce business monetizes product sales along with recurring satellite airtime subscription fees — an archetypal hybrid revenue model merging hardware upfront sales with sustained service fees that can drive customer lifetime value if scaled efficiently.
The Healthcare segment crucially depends on pharmaceutical wholesale distribution sourced predominantly through a single third-party distributor—signaling significant supply chain concentration risk—a vulnerability particularly acute given the pharmaceutical industry's sensitivity to regulatory reimbursement shifts and pricing limitations [S1,F1]. The healthcare operation also participates in the federal 340B Drug Pricing Program via contract pharmacies contributing materially to margins; however, recent years have seen erosion in this revenue stream.
Consequently, regulatory compliance pressures, price caps on pharmaceuticals reimbursed through government programs, and competitive dynamics within pharmacy services collectively weigh on margin stability. This is reflected in the reported $12.6 million year-over-year revenue decline in Healthcare Operations for 2025 largely attributable to contract attrition and prescription volume drops [S21]. Gross margins declined accordingly from 26% to roughly 20%, partially due to reduced high-margin 340B contract revenues coupled with increased airtime service costs after expiration of prior favorable contracts within the e-Commerce segment.
Platform Development Progress Amid Working Capital Constraints
Advanced investments into NextPlat’s proprietary technology platforms—especially those enhancing healthcare analytics and pharmacy management capabilities such as their ClearMetrX solution—represent critical enablers of long-term competitive positioning but exert near-term strain on cash flows [S1,S2]. Management has responded by trimming executive compensation by approximately $1.2 million and reducing headcount this quarter—direct levers to curtail fixed costs while sustaining development momentum.
Such strategic spending reflects a typical industry tradeoff where platform development delays meaningful profit contribution yet creates future scalability potential if user adoption and retention metrics improve [S1]. These efforts are compounded by simultaneous acquisition activity intended to broaden service offerings geographically and technologically but carry integration risks that could divert focus or inflate expenses if not meticulously executed
Competitive Context: Sizing Up Pharma Wholesale Distributors vs. Digital Health Peers
NextPlat straddles heterogeneous peer groups reflective of its diversified model. Within pharmaceutical wholesale distribution, firms such as McKesson and Cardinal Health dominate global scale with highly optimized supply chains enabling favorable cost structures and expansive reach—a substantial barrier given network complexity. In contrast, NextPlat's reliance on a single supplier highlights exposure imbalance that peers mitigate through wider sourcing diversification.
On the digital health front, competitors like GoodRx or Capsule emphasize rapid customer acquisition via streamlined online experiences paired with analytics-driven personalized offerings—a domain where platform user growth rates, customer retention percentages, and customer acquisition costs are pivotal KPIs weighing heavily on sustainable operating leverage. NextPlat’s technological advancements potentially bridge some capability gaps but lack disclosed proprietary advantages or network moats differentiating it decisively within either peer cluster.
Growth Catalysts Focus: Expansion Through Acquisitions and Tech Integration
Growth ambitions hinge upon NextPlat’s execution of strategic acquisitions aligned with expanding healthcare services footprint alongside augmenting technology-enabled offerings such as enhanced data analytics [S1]. These M&A moves can yield immediate incremental revenues while facilitating cross-selling opportunities across existing e-Commerce channels—a synergistic effect enhancing gross margin prospects if successfully integrated.
Nonetheless, without explicit details on transaction terms or pipeline visibility, these remain conditional potential drivers rather than proven accelerants. Moreover, heavy dependence on a single pharmaceutical distributor amplifies supply interruption vulnerability—an acute risk where COVID-era disruptions have heightened market awareness.
Healthcare regulation evolution further clouds reimbursement predictability critical for pharmacy segment profitability; unfavorable legislative changes could sharply compress margins. Additionally, ongoing class action litigation alleging fiduciary breaches post-merger underscore legal exposures that could generate financial contingencies impacting balance sheet resilience.
Monitorables: Cash Flow Metrics, Customer Retention Rates, and Order Fulfillment Trends
Operational KPIs central for monitoring NextPlat’s trajectory include sequential operating cash flow improvements signaling enhanced working capital efficiency; days sales outstanding (DSO) revealing receivable collection agility; customer retention rates especially within digital platforms reflecting user engagement dynamics; plus order fulfillment timings reflective of supply chain robustness—all key markers validating management’s cost discipline versus market demand evolution [S2]
These indicators collectively offer early visibility into whether controlled expense initiatives translate sustainably into positive liquidity inflection points amid cyclical sector pressures.
Financial Position Discussion: Liquidity Cushion Balanced Against Continuing Net Losses
Despite enduring losses—for instance operating income was negative $9 million for 2025—the company's liquidity position remains relatively solid with a current ratio of 2.29 backed by approximately $11.9 million in cash versus modest total debt near $1 million as of June 30, 2026 [F1,S2]. It does not constitute investment advice or research view.*
Disclaimer: This is research-only, informational analysis and not investment advice. It may include AI-generated interpretation and general industry context. Always verify important details using primary sources.

Comments