
Orange County Bancorp’s Community Model Drives Stability and Expansion in Lower Hudson Valley
Q1 2026 results underscore Orange County Bancorp’s steady execution of its relationship-driven banking model alongside growing wealth management assets.
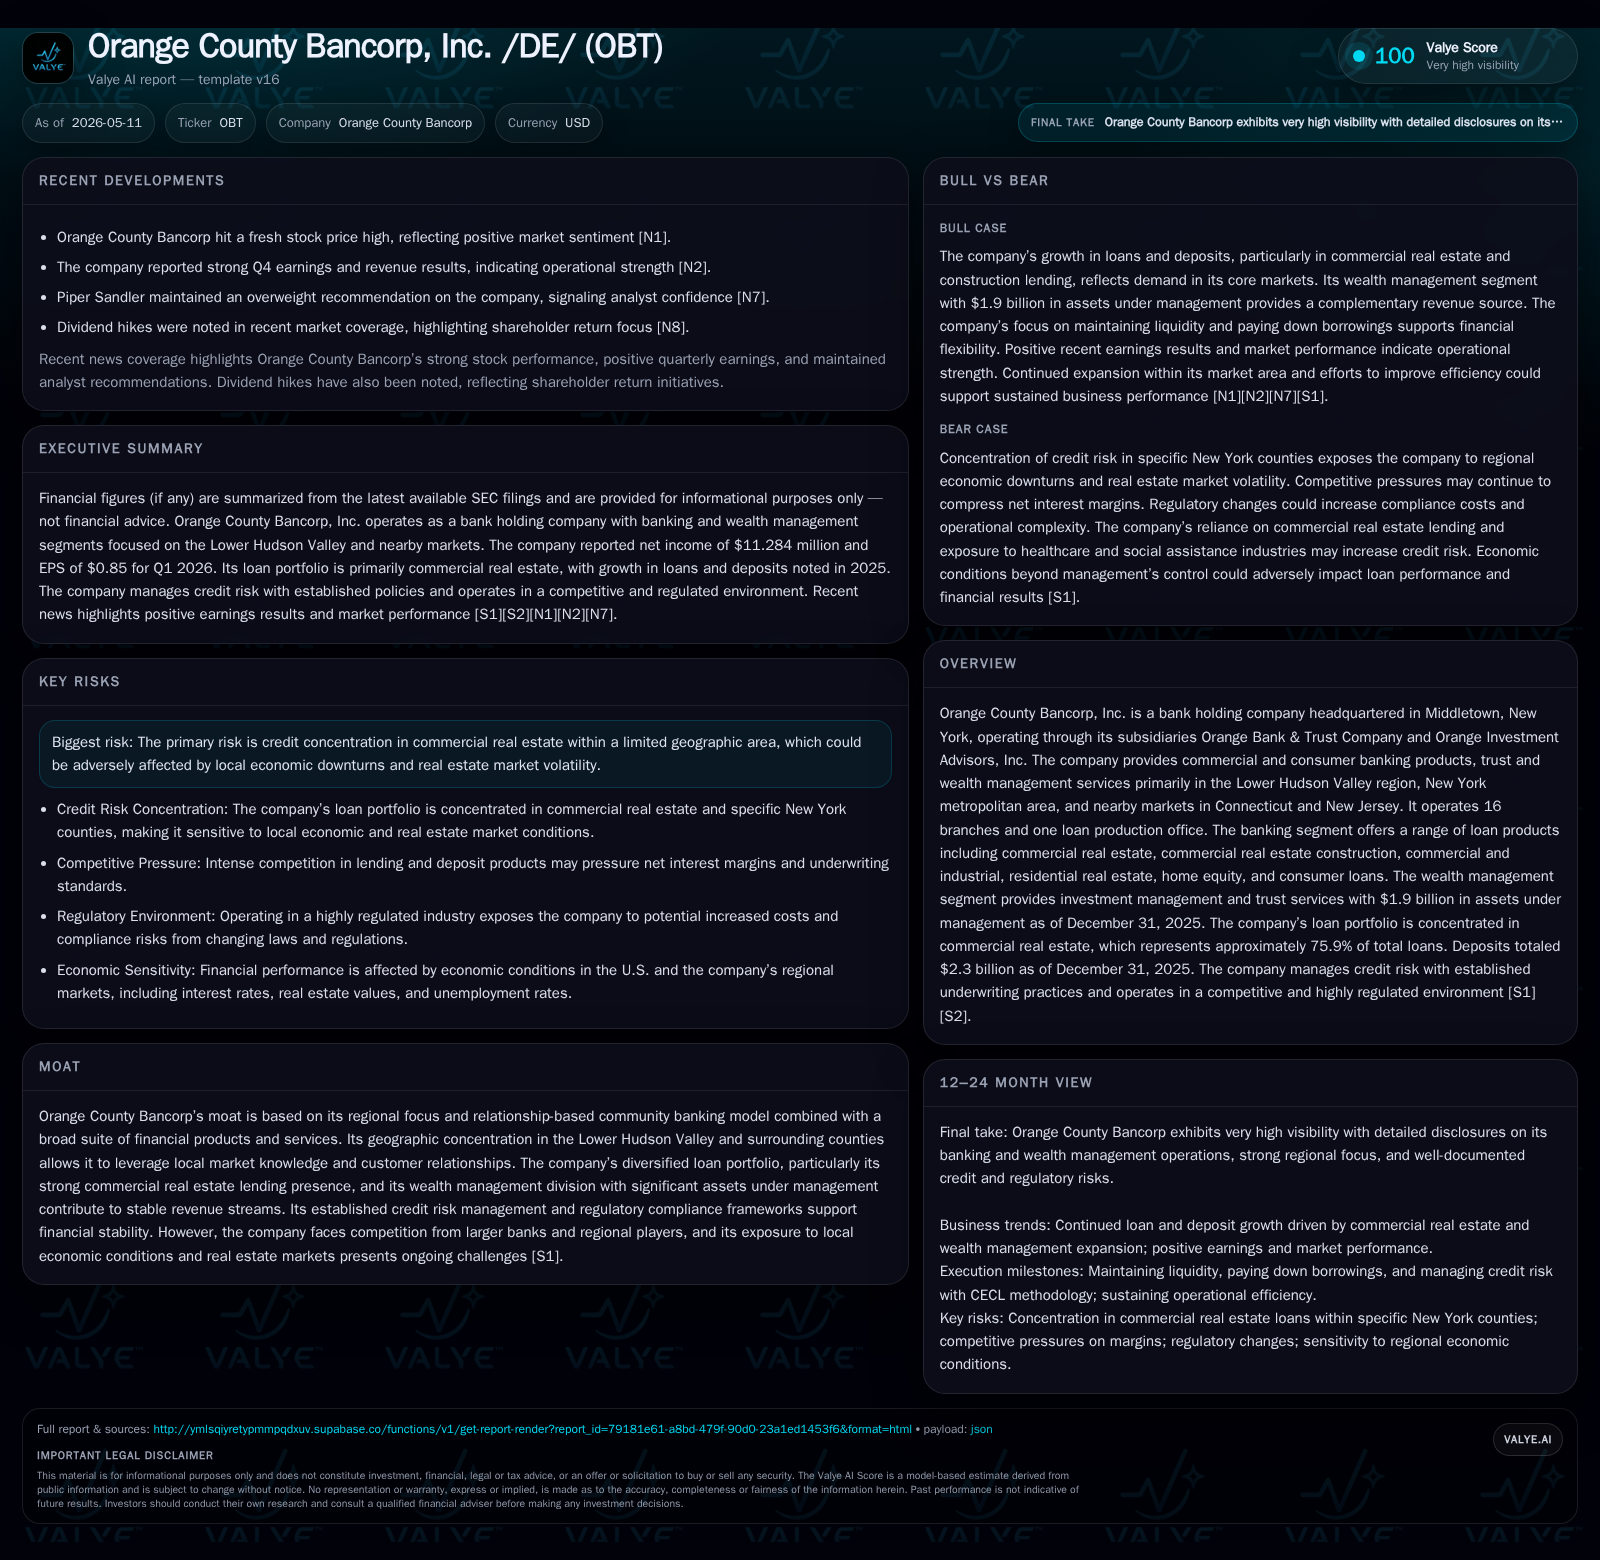
Orange County Bancorp reported a resilient first quarter in 2026, with stable credit quality amid modest loan portfolio growth concentrated in commercial real estate. The bank’s community-focused model, anchored in the Lower Hudson Valley region, blends a diversified loan book and $1.9 billion in wealth management assets to drive consistent revenues. Competitive pressures from larger banks persist, but OBT’s geographic niche and customer relationships support its moat. Key risks revolve around commercial real estate concentration and regional economic exposure. Near-term monitoring will focus on loan portfolio quality dynamics, deposit behaviors, and wealth advisory growth.
Q1 2026 Operating Update: Fresh Insights from the Latest 10-Q
Orange County Bancorp’s latest quarterly filing dated May 11, 2026 ([S2]) presents measured operational stability amidst ongoing challenges inherent to its concentrated commercial real estate loan portfolio. The company reported that its allowance for credit losses remains appropriately calibrated across major loan segments reflecting stable underwriting and risk management protocols. Notably, the provision for credit losses was slightly negative at $(436) thousand for Q1 2026, down from a $202 thousand provision a year prior ([S24]), indicating benign credit trends without new material deterioration.
The loan portfolio showed modest growth of approximately $132 million year-over-year as net loans rose to about $1.95 billion by the end of 2025 ([S7]). Commercial real estate loans comprised roughly 75.9% of total loans, underscoring the centrality of this segment despite inherent concentration risks. Construction lending also increased notably to just over $99 million (5.09%), reflecting activity in new projects within the bank's core markets.
On April 28, 2026, the company issued an earnings press release via an 8-K filing ([S3]) reaffirming its financial performance and strategic focus areas including tight credit risk oversight and expansion of wealth advisory services.
Core Business Model: Community Banking Plus Integrated Wealth Management
Orange County Bancorp operates primarily through Orange Bank & Trust Company and Orange Investment Advisors (OIA), blending full-service commercial and consumer banking with trust and wealth management capabilities ([S1],[S2]).
The bank’s network includes sixteen branches plus one loan production office concentrated in New York’s Lower Hudson Valley region along with adjacent Connecticut and New Jersey markets ([S1]). Its business banking platform emphasizes diverse deposit products including specialized municipal accounts which help sustain a low-cost core deposit base.
Loan offerings span commercial real estate—including both owner-occupied and investor properties—commercial & industrial loans serving local businesses, residential mortgages, home equity lines, and consumer loans. The heavy tilt toward commercial real estate reflects regional market characteristics but raises concentration considerations.
On the wealth side, OIA manages $1.9 billion in client assets as of December 31, 2025 ([S1]), generating fee income that diversifies revenue beyond interest margins. This capability not only supplements earnings but also enhances client engagement through cross-selling opportunities anchored on personalized advisory services.
The relationship-focused model cultivates switching costs among middle-market enterprises, municipal clients, and affluent individuals by integrating banking and wealth products under one umbrella.
Competitive Landscape and Industry Dynamics in Lower Hudson Valley Regional Banking
OBT faces competition from larger national banks offering scale advantages as well as regional peers pursuing overlapping territory. Still, OBT’s entrenched local presence coupled with community banking traits—high-touch service interaction, bespoke credit solutions—underpin its competitive moat ([S1]).
New York state regulatory environment imposes prudent capital conservation buffers governing dividend policies—a factor OBT complies with ensuring well-capitalized status ([S16]). These regulatory contexts shape OBT's capital deployment strategy balancing growth ambitions with financial safety.
Branch network size limits rapid scale expansion but enables focused market penetration where relationship depth is highest. Competitive pricing power is influenced by prevailing short-term interest rates driven by Federal Reserve policy alongside local market competition for deposits and loans.
Growth Catalysts: Commercial Real Estate, Wealth Assets, and Deposit Trends
Commercial real estate lending continues as the cornerstone growth driver given the bank's established expertise and customer base ([S7],[F1]). Although cyclically sensitive to regional economic fluctuations, ongoing demand for CRE financing underpins volume stability with disciplined credit assessment mitigating downside.
Wealth management segment growth adds recurring fee income resilience as asset inflows benefit from favorable market performance combined with proactive client acquisition strategies ([S13]). Effective cost management within this division further supports profitability enhancement.
Deposit growth benefits from longstanding municipal relationships providing stickiness and contributing to a low-cost funding profile pivotal during interest rate volatility periods ([S1],[F1]). Business banking expansion initiatives targeting middle-market enterprises help broaden core deposits fueling sustainable lending capacity.
Key KPIs to track include quarterly loan origination trends across segments, AUM net inflows or outflows, deposit retention ratios amid competitive pressure, and noninterest income growth from advisory fees.
Risks and Headwinds: Portfolio Concentrations and Regional Economic Dependencies
Despite strengths, substantial concentration (over three-quarters) of outstanding loans in commercial real estate located principally within the Lower Hudson Valley exposes OBT to localized downturns affecting property valuations or cash flow generation ([S1],[F1]).
Such geographic-limited exposure means regional economic shocks—such as declines in real estate activity or employment disruptions—could disproportionately impact loan performance requiring vigilance in credit monitoring.
Regulatory capital requirements necessitate maintaining buffers that may constrain dividend flexibility or incremental capital deployment especially if risk-weighted assets fluctuate due to changing underwriting standards or loan mix shifts ([S16]).
Interest rate sensitivity poses additional uncertainty impacting net interest margin through deposit cost adjustments or yield on reinvested securities while consumer behaviors toward borrowing may evolve with macroeconomic dynamics.
Key Milestones and What to Monitor Next
Investors and industry watchers should watch for updates in upcoming quarterly reports on:
- Loan portfolio quality metrics including nonperforming assets levels or changes in allowance for loan losses,
- Deposit cost trajectory contextualized against market interest rate movement,
- Wealth management AUM growth momentum signaling bottom-line diversification,
- Regulatory developments affecting capital requirements or dividend policies,
- Execution progress on expanding business banking solutions enhancing deposit base stability ([S2],[S3]).
These indicators will clarify whether the current stability extends into sustained organic growth phase or if tightened credit conditions emerge requiring strategic adjustments.
Concise Financial Profile: Evaluating Capital, Credit, and Liquidity
As of December 31, 2025, Orange County Bancorp reported total assets near $2.7 billion with net loans approximately $1.92 billion net of allowance for credit losses totaling about $28 million ([S7],[F1]). Deposits stood at roughly $2.3 billion supported largely by stable core retail and municipal accounts ([S1]).
Investment securities classified as available-for-sale amounted to about $419 million providing liquid buffer capacity alongside cash equivalents exceeding $200 million when including federal funds ([S6],[S22]).
Capitalization remains robust with stockholders’ equity of approximately $284 million placing the company comfortably above "well capitalized" thresholds established by regulators ([S16]). Borrowings are minimal relative to deposits highlighting conservative funding reliance primarily on deposits rather than wholesale borrowing sources.
Allowance for credit losses segmentation per portfolio type suggests disciplined risk management adapted through granular assessments incorporating collateral quality sectors and borrower characteristics ([S2]). This approach supports healthy earnings generation evidenced by net income over $41 million for full-year 2025 ([F1]) and continuing profitability each quarter.
Overall liquidity appears sufficient to meet contingent obligations while maintaining lending flexibility amid competitive pressures or macroeconomic shifts.
This analysis is based solely on information explicitly supported by recent SEC disclosures as cited. It should not be construed as investment advice.
Disclaimer: This is research-only, informational analysis and not investment advice. It may include AI-generated interpretation and general industry context. Always verify important details using primary sources.
Comments