
OPAL Fuels' Shift from Renewable Power to RNG Market Strength
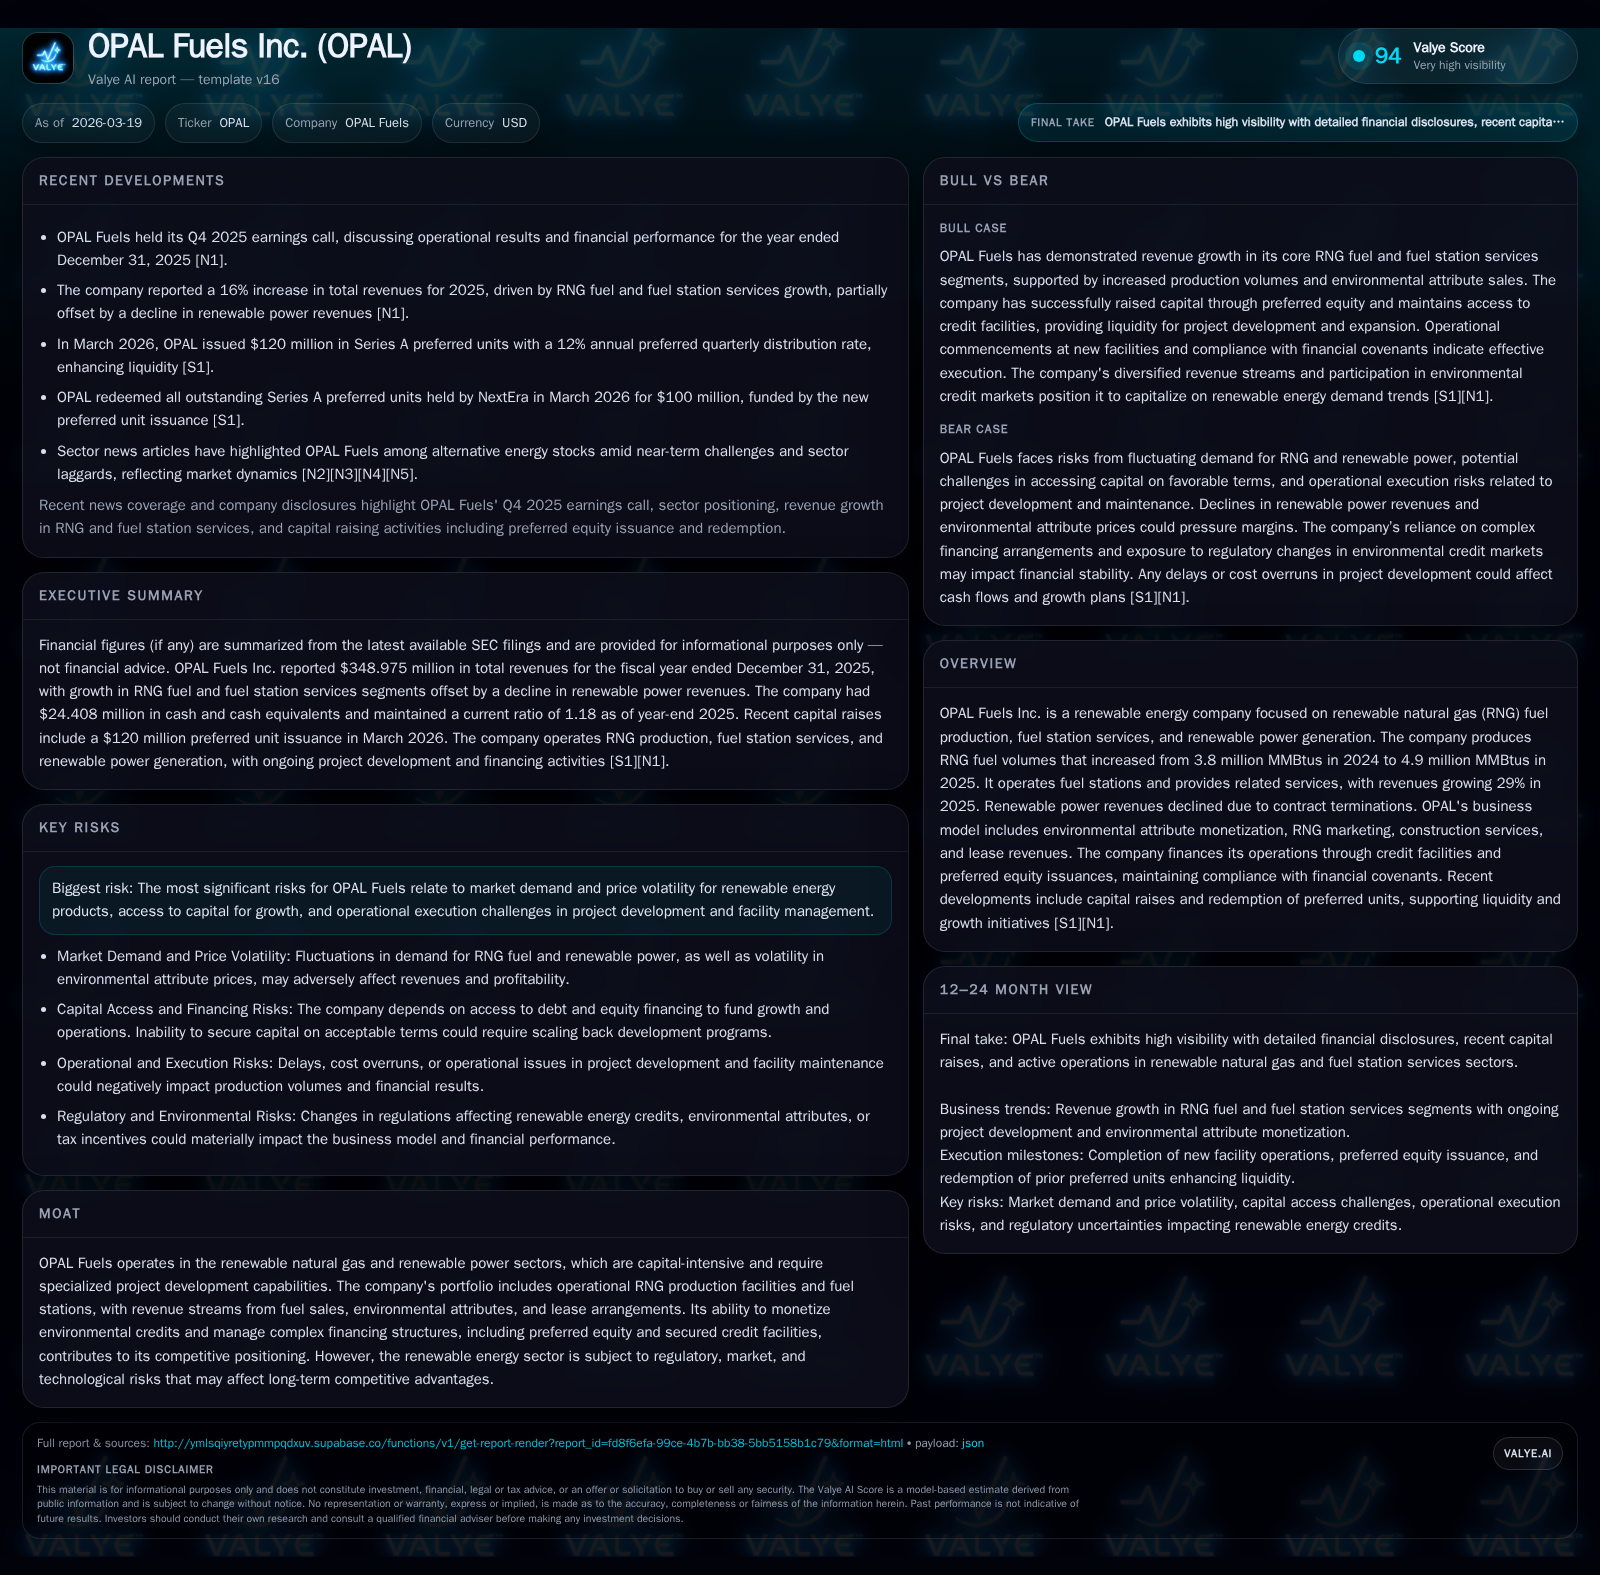
OPAL Fuels expanded renewable natural gas volumes and fuel station services in 2025, offsetting declines in renewable power segment revenues while managing capital and operational complexities.
In 2025, OPAL Fuels Inc. reported significant revenue growth driven primarily by a 29% increase in Fuel Station Services and a 15% rise in renewable natural gas (RNG) fuel segment volumes. However, this growth was counterbalanced by a 27% decline in renewable power revenues, reflecting contract terminations and strategic repositioning. The company maintained compliance with financial covenants amid an evolving capital structure including credit facility amendments and preferred equity redemptions. Operational challenges, including an ongoing arbitration related to EPC contracts, inject execution risks. Future growth hinges on project pipeline development, environmental credit pricing, and fleet adoption of RNG fuel.
2024-2025 Growth Drivers: RNG Production and Fuel Station Services Surge
Historical performance (annual)
| FY | Rev ($mm) | CFO ($mm) | OpInc ($mm) | Capex ($mm) | Rev YoY |
|---|---|---|---|---|---|
| 2025 | 349 | 36 | 7 | 71 | +16.3% |
| 2024 | 300 | 33 | 21 | 127 | +17.1% |
| 2023 | 256 | 38 | 7 | 114 | +8.7% |
| 2022 | 236 | -1 | 2 | 131 |
Source: SEC companyfacts cache [F1].
Capital returns and efficiency (annual)
| FY | FCF ($mm) |
|---|---|
| 2025 | -34 |
| 2024 | -94 |
| 2023 | -76 |
| 2022 | -133 |
Source: SEC companyfacts cache [F1].
OPAL Fuels demonstrated robust top-line momentum in fiscal year 2025 with total revenues increasing roughly 16.3% year-over-year to $349.0 million [F1]. This expansion was largely anchored by the Renewable Natural Gas (RNG) fuel segment—where production volume grew from approximately 3.8 million MMBtus in 2024 to nearly 4.9 million MMBtus in 2025—and the Fuel Station Services business which surged by almost 29%.[S1][F1] Revenue specifically attributable to RNG fuel rose by $13.2 million (15%), reaching just over $101.6 million.[S1][F1]
Fuel Station Services reflected strength across multiple subcomponents including OPAL-owned stations sales (+$3.3 million), environmental attribute monetization (+$9.6 million), RNG marketing (+$9.4 million), third-party station maintenance (+$3 million), construction services (+$9.3 million), and lease revenues.[S1] This diversified service model supports not only direct fuel sales but also downstream infrastructure deployment and operational management.
The growth correlates with rising commercial fleet adoption of RNG solutions despite continued price volatility within energy markets.[S1] The company’s ability to leverage its expanding portfolio of fueling stations amplifies revenue exposure beyond pure commodity sales toward ancillary fee-based streams.
Renewable Power Segment Challenges Impacting Revenues
Conversely, OPAL’s Renewable Power segment experienced a notable contraction of approximately 27%, with revenues decreasing from $44.7 million in 2024 to $32.8 million in the latest fiscal year.[F1] This decline resulted largely from the termination of several power purchase agreements (PPAs) and strategic divestment or reduction of assets within that portfolio.[S1]
While Renewable Power historically provided a steady source of fixed or market-indexed revenue streams under operating leases or PPAs,[S14] ongoing contractual unwindings reflect a deliberate shift toward RNG focus given improved economics in that segment alongside operational complexities inherent in maintaining these facilities.
Project Development Pipeline and Market Demand Outlook
OPAL’s project pipeline centers around Biogas Conversion Projects—facilities that convert organic waste into RNG via anaerobic digestion technology.[S1] The success of these projects is predicated on securing contractual biogas rights from site owners/operators who maintain control over underlying feedstock inputs.[S1] Management highlights operational risks tied to uncertainties around feedstock quality/quantity warranties absent from third-party agreements.[S1]
Additionally, interconnection constraints at transmission and pipeline facilities pose logistical bottlenecks,[S1] which may delay commissioning or restrict output capacity. Vendor dependencies also expose OPAL to risks linked with equipment manufacturing defaults or service delivery delays as evidenced by its ongoing arbitration with CEI Builders over EPC contract disputes on two California-based facilities.[S16]
Fleet customer adoption remains critical: commercial customers may opt for competing renewable fuels or electrification alternatives,[S1] adding external demand uncertainty that could cap future volumetric growth.
Environmental Attribute Monetization Amid Regulatory Pressures
Environmental credits represent a pivotal margin enhancer within OPAL’s integrated business model.[S1] The company transacts Renewable Identification Numbers (RINs), International Sustainability & Carbon Certification (ISCC) Carbon Credits, Low Carbon Fuel Standard (LCFS) credits and other emissions incentives derived from RNG production.[S1]
These attributes significantly augment the effective realized price per unit of RNG yet introduce sensitivity to regulatory regime shifts and market supply-demand imbalances for such credits.[S1] Price volatility for RINs, fluctuating LCFS credit valuations tied to California’s carbon policy adjustments, and federal incentive program refinements are material factors OPAL actively monitors as potential upside or downside catalysts.
Capital Structure Evolution: Credit Facilities, Preferred Equity, and Covenant Management
OPAL maintains a complex financial arrangement balancing credit facilities, preferred equity instruments, and covenant compliance geared toward supporting capital-intensive RNG project development.[S4][S6][S7]
Notably, amendments during early 2025 extended delayed draw term loan availability through March 2026 delaying principal repayments’ commencement,[S5] providing breathing room for project capitalization cycles. Term loans bear increasing margins over Term SOFR starting near 3.5%, escalating based on duration,[S7] reflecting rising borrowing costs.
NextEra’s redemption option exercised late Q4’25 saw preferred units redeemed at $100 million funded through newly issued Series A preferred units purchased by an affiliate of Fortistar for $120 million[S9][S18][N1], setting terms for quarterly cumulative distributions at a compounded rate near 12%. This transaction alleviated legacy preferred unit obligations while injecting fresh capital aligned with growth expectations.[S18]
Debt service coverage ratios mandated maintain minimum thresholds (≥1.2x trailing four quarters) alongside leverage ceilings (≤4x cash flows post-draw period).[S5][S6] As of December 31, 2025, OPAL reports covenant compliance amid ongoing credit utilization approximating $341.6 million outstanding loans under the senior secured facility.[F1]
Operating Efficiency and Cost Trends Affecting Margins
Operating expenses outpaced revenue growth during FY25—cost of sales rose sharply across RNG fuel (+28%) and Fuel Station Services (+29%) consistent with volume scale effects but compressed gross margins.[S1]
Project development/startup expenses declined ~22%, attributed primarily to reduced virtual pipeline transport costs associated with maturing projects such as Prince William and Polk facilities entering steady-state operation phases.[S19]
Selling, general & administrative expenses increased ~20%, reflecting escalated professional fees (+$1.9m), expanded IT/legal costs (+$4m), stock-based compensation (+$1.1m), and bad debt expense provisions (+$2.5m).[S19]
Depreciation surged +26%, amplified by fully operational recent facility assets and expanding fuel station infrastructure depreciated under operating leases.[S19]
Consequently, despite revenue acceleration of +16%, reported operating income declined significantly (down ~65% YoY), underscoring margin dilution consistent with mid-stage scaling dynamics intertwined with legal/arbitration-related costs linked to EPC disputes.[F1][S16]
Cash Flows, Capital Expenditures, and Free Cash Flow Analysis
Cash flows from operations increased modestly by about +10.5% YoY reaching $36.5 million in FY25 compared with prior year’s $33.0 million.[F1]
Capital expenditures fell markedly (-44%) to approximately $70.7 million driven by completion phases of key RNG production facilities alongside moderating investments in fueling station rollouts relative to prior buildout intensity observed in FY24 ($127mm).[F1][S19]
The resulting free cash flow (CFO minus Capex) remains negative at approximately -$34.2 million—a characteristic feature for renewable energy companies engaged in asset buildouts requiring upfront capex infusions before steady cash generative maturity.[F1]
Return Measures and Distribution Policies: ROE, Dividends, and Buybacks
Reported equity remains negative at approximately -$13 million primarily due to accumulated deficits impacted by accounting effects surrounding redeemable preferred interests classified outside shareholders’ equity.[F1]
Given positive net income allocated mainly toward redeemable non-controlling interests ($21+ million attributable earnings) versus modest positive common stockholder net income ($4.3 million)[S1][F1], measuring conventional ROE proves complex but yield approximations indicate very high returns if computed solely on residual common equity.
No dividends or common share repurchase programs were announced or declared according to filings; mandatory cumulative dividends on redeemable preferred non-controlling units totaled roughly $10.5 million consistently across years reflecting fixed dividend obligations inherent in preferred securities structure [S23].
Legal Disputes and Operational Risks in Project Execution
A notable issue impacting timeline certainty arises from a legal dispute involving two key California digester projects where OPAL initiated arbitration against EPC contractor CEI Builders over disputed change order requests totalling approximately $14M per project related primarily to design modification demands tied to performance guarantees alongside equipment manufacturer defaults [S16].
Contracts contain surety bonds intended as financial protections; however ongoing litigation potentially delays completion schedules elevating project delivery risks and reputational exposure within increasingly competitive sector landscapes dependent on turnkey execution efficiency.
Future Milestones and Strategic Watchpoints for Investors
Critical upcoming milestones include approaching expiry of the delayed draw availability period under the senior secured credit agreement scheduled March-end – necessitating additional capital raises or refinancing maneuvers if new projects require funding beyond existing facility commitments [S4][N1].
Debt amortization formally commences thereafter with final maturities stretching into late FY28 requiring continued disciplined covenant monitoring given leverage ratios near permitted limits [S7].
Fleet customer penetration trends for RNG remain watchworthy as systemic adoption rates directly influence volumetric expansion projections; likewise evolving federal/state carbon credit frameworks impacting RINs/LCFS valuations will materially affect revenue quality beyond volume metrics.
Additionally pending resolution outcomes from EPC arbitration proceedings will influence both cost structures as well as confidence intervals for project rollout forecasts.
This analysis integrates information extracted from OPAL Fuels Inc.'s SEC filings as of March 16, 2026 ([S#]) combined with numeric data sourced from companyfacts datasets ([F1]) and recent news transcripts ([N#]). The views herein aim solely at elucidating historical performance drivers plus foreseeable challenges without proffering investment advice or forward guidance beyond documented disclosures.
Disclaimer: This is research-only, informational analysis and not investment advice. It may include AI-generated interpretation and general industry context. Always verify important details using primary sources.
Comments