
Oric Pharmaceuticals’ Financial Trajectory: Balancing Pipeline Hurdles and Capital Efficiency
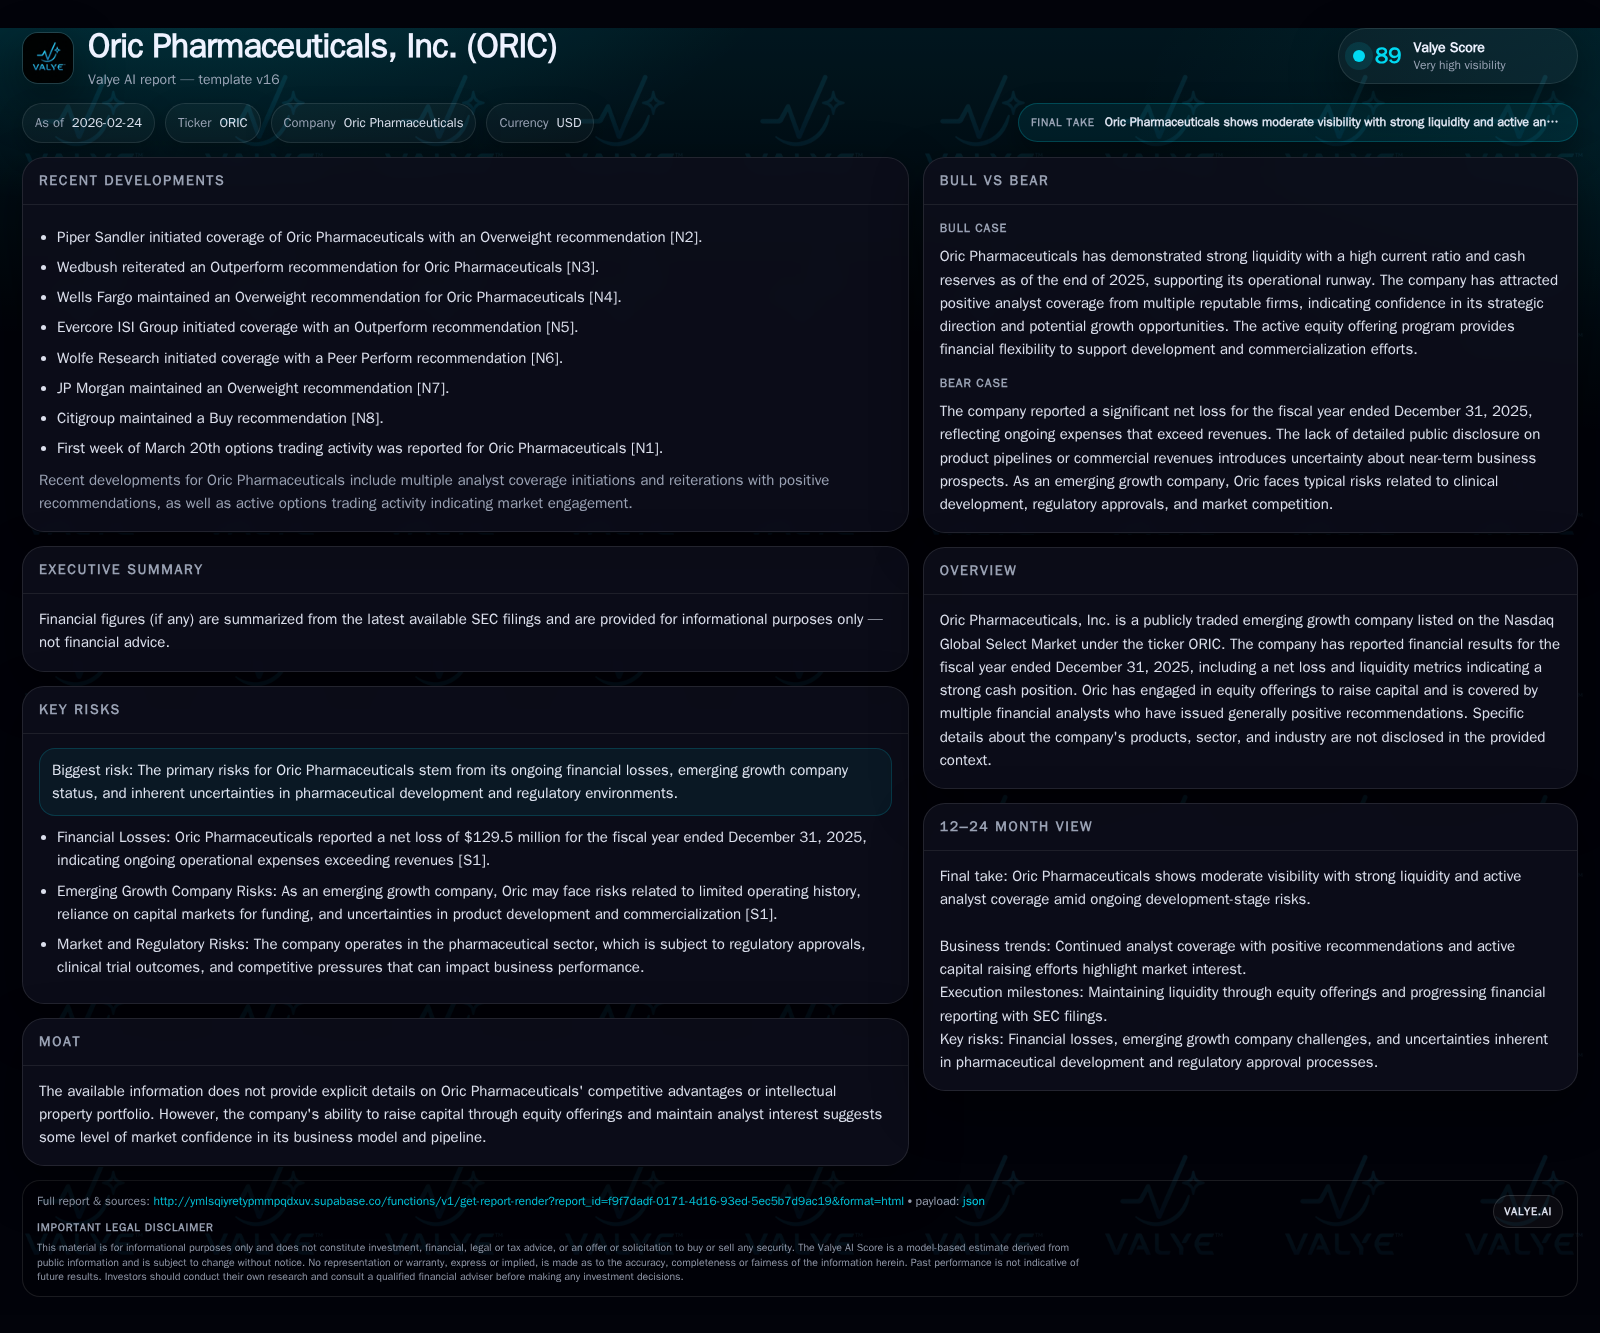
Oric Pharmaceuticals maintains robust liquidity through equity capital raises despite sustained operating losses, as it pushes forward its clinical-stage pipeline amid regulatory and development uncertainties.
Oric Pharmaceuticals continues to operate with substantial net losses driven by clinical-stage R&D expenses, while strategically bolstering its liquidity via ATM equity offerings that have raised close to $140 million recently. Minimal capex reflects its focus on research investments rather than fixed assets, and the company currently prioritizes reinvestment over dividends or buybacks. Future growth depends heavily on clinical trial outcomes and regulatory milestones, which remain the principal catalysts but also significant sources of risk given the early-stage nature of Oric’s pipeline. The firm’s strong current ratio above 14 underlines a solid short-term financial position to sustain ongoing cash burn. Return metrics such as ROE are negative at approximately -33.7%, reflecting ongoing losses; no dividends or share repurchases have been reported in recent filings [F1],[S9],[S11],[S12].
Financial Performance Trends: Unpacking Operating Losses and Cash Flow Dynamics
Oric Pharmaceuticals’ financial history over the past four fiscal years reveals a stable yet deepening pattern of operating losses characteristic of clinical-stage biopharmaceutical companies without commercial products. Operating income losses worsened from -$91.8 million in FY2022 to -$143 million in FY2025, with year-over-year changes flattening between FY2024 and FY2025 (-0.1%) indicating that cost escalation has somewhat plateaued recently [F1]. Net income follows a similar trajectory with losses increasing from -$89.1 million in FY2022 to -$129.5 million in FY2025, reflecting persistent negative profitability amid heavy R&D expenditures.
Operating cash flow (CFO) remains significantly negative throughout this period—approximately -$111 million in FY2025 compared to -$112.7 million last year—highlighting ongoing cash burn primarily due to research activities rather than operational revenue generation typical of this stage of development [F1]. Capital expenditure has consistently been low relative to the cash burn, falling sharply by over 40% YoY from $1.2 million in FY2024 to just $0.7 million in FY2025, confirming that fixed asset investments are not a primary driver of outflows.
Historical performance (annual)
| FY | Net ($mm) | CFO ($mm) | OpInc ($mm) | Capex ($mm) | Net YoY |
|---|---|---|---|---|---|
| 2025 | -129 | -111 | -143 | 1 | -1.3% |
| 2024 | -128 | -113 | -143 | 1 | -27.0% |
| 2023 | -101 | -86 | -111 | 1 | -13.0% |
| 2022 | -89 | -75 | -92 | 2 |
Note: Omitted columns lack sufficient annual XBRL coverage in the provided tags (need ≥2 annual points): Rev, Div, Buybacks. Source: SEC companyfacts cache [F1].
Capital returns and efficiency (annual)
| FY | FCF ($mm) | ROE% |
|---|---|---|
| 2025 | -112 | -33.7 |
| 2024 | -114 | -52.6 |
| 2023 | -87 | -44.9 |
| 2022 | -77 | -40.1 |
Source: SEC companyfacts cache [F1].
Source: SEC filings and XBRL data [F1]
Equity Capital Influx and Liquidity Position: Strategic Backing for Growth
Despite sustained heavy net losses and negative cash flows, Oric Pharmaceuticals has effectively maintained an enviable liquidity position by leveraging an at-the-market (ATM) equity offering program initiated back in May 2021 with Jefferies LLC as sales agent [S9]. The most recent prospectus supplement filed on March 11, 2024 authorized share sales up to $200 million; through February 23, 2026, the company sold approximately 13.48 million shares raising gross proceeds near $139.7 million before commissions and expenses [S9],[S12]. Furthermore, a new prospectus supplement was filed as recently as February 26, 2026, extending authorization for another $200 million issuance under this program providing additional optionality for capital infusion going forward.
This equity issuance strategy has translated into an exceptionally strong current ratio standing at roughly 14 as of December 31, 2025 (current assets of $288 million versus current liabilities around $20 million), which voices a proactive effort to cover near-term liabilities amid high cash burn rates [F1]. Cash and equivalents form about $45.7 million of these assets providing essential runway for ongoing R&D expenditures.
Pipeline Progress and Development Risks: What the SEC Filings Reveal
Public disclosures offer limited direct details regarding Oric’s specific drug candidates or therapeutic areas; however, the company remains a clinical-stage development entity confronting intrinsic risks tied to drug development timelines and regulatory milestones [N1],[S3]. Risk factors across recent SEC filings emphasize uncertainties surrounding successful trial outcomes, potential delays navigating FDA approvals, intellectual property challenges, and litigation exposure ubiquitous within biotechnology innovation ecosystems [S4],[S5],[S6]. These constraints underscore how progress towards commercialization depends critically on pivotal binary events such as phase trial data readouts or FDA responses.
Cash Burn Drivers and Cost Management Amidst R&D Intensification
Oric’s minimal capital expenditure spending—less than $1 million annually since FY2023—implies that there is little infrastructure expansion or plant investment occurring; instead, costs are dominated by operational expenses tied primarily to personnel remuneration, external research collaborations (potentially contract research organizations), regulatory compliance activities, and manufacturing-related R&D initiatives [F1],[S1]. The slight decrease in capex juxtaposed with stable but large operating losses signals tight control over fixed asset growth while accepting elevated variable spending levels necessary during drug development phases.
Capital Allocation: Dividends, Buybacks, and Reinvestment Priorities
Consistent with norms for emerging growth biotechs still pre-commercialization stage, Oric has not paid dividends nor engaged in share repurchase programs according to SEC filings spanning multiple recent periods through early 2026 [S9],[S11],[S12]. Return metrics such as ROE stand at approximately -33.7%, reflecting ongoing net losses relative to shareholder equity at year-end FY2025 [F1]. Instead, capital allocation is heavily weighted toward reinvestment aimed at sustaining pipeline advancement efforts rather than distributing cash back to shareholders at this juncture.
Anticipated Catalysts and Key Milestones On Oric’s Horizon
Explicit guidance on upcoming milestones is sparse; nevertheless, analyst reports show some optimism linked to expected trial readouts or regulatory submissions scheduled for early-to-mid-2026 calendar year windows typical for companies undergoing phase transition in clinical development cycles [N1],[S3]. Investors should monitor trial progression updates—particularly from programs like enozertinib (ORIC-114)—and new partnership announcements or licensing activities as potential valuation inflection points given their impact on perceived de-risking.
Risks from Regulatory Environment and Ongoing Litigation
As reflected throughout Item 1A Risk Factors sections of several recent SEC documents ([S4],[S5],[S6]), Oric navigates a landscape fraught with regulatory scrutiny including adverse FDA decisions or delayed approvals that could extend timelines indefinitely or require costly additional studies impacting both finances and market perception.
Also noted are standard litigation risks often encountered by pharma developers relating to patent disputes or product liability claims which could further strain operational resources if escalated.
This analysis synthesizes the most recent available audited financials alongside SEC-disclosed corporate developments for Oric Pharmaceuticals as of early calendar year 2026 focusing solely on explicit public data points without extrapolation beyond provided disclosures.
The company presents a classical profile of a clinical-stage biotech balancing substantial operating deficits fueled by robust R&D investments against strategic capital market access through ATM offerings enabling continued execution on its developmental roadmap amidst inherent sectoral risks.
Investors should carefully track pipeline progression events alongside capital structure changes given their pivotal role in shaping future financial sustainability prospects.
This document is prepared for informational purposes only based on publicly available sources without any investment recommendation.
Disclaimer: This is research-only, informational analysis and not investment advice. It may include AI-generated interpretation and general industry context. Always verify important details using primary sources.
Comments