
Principal Financial Group Inc's Revenue Dip and Strategic Capital Moves in 2025
Despite a revenue contraction in 2025, Principal Financial Group sustains steady capital return initiatives amid market and regulatory challenges.
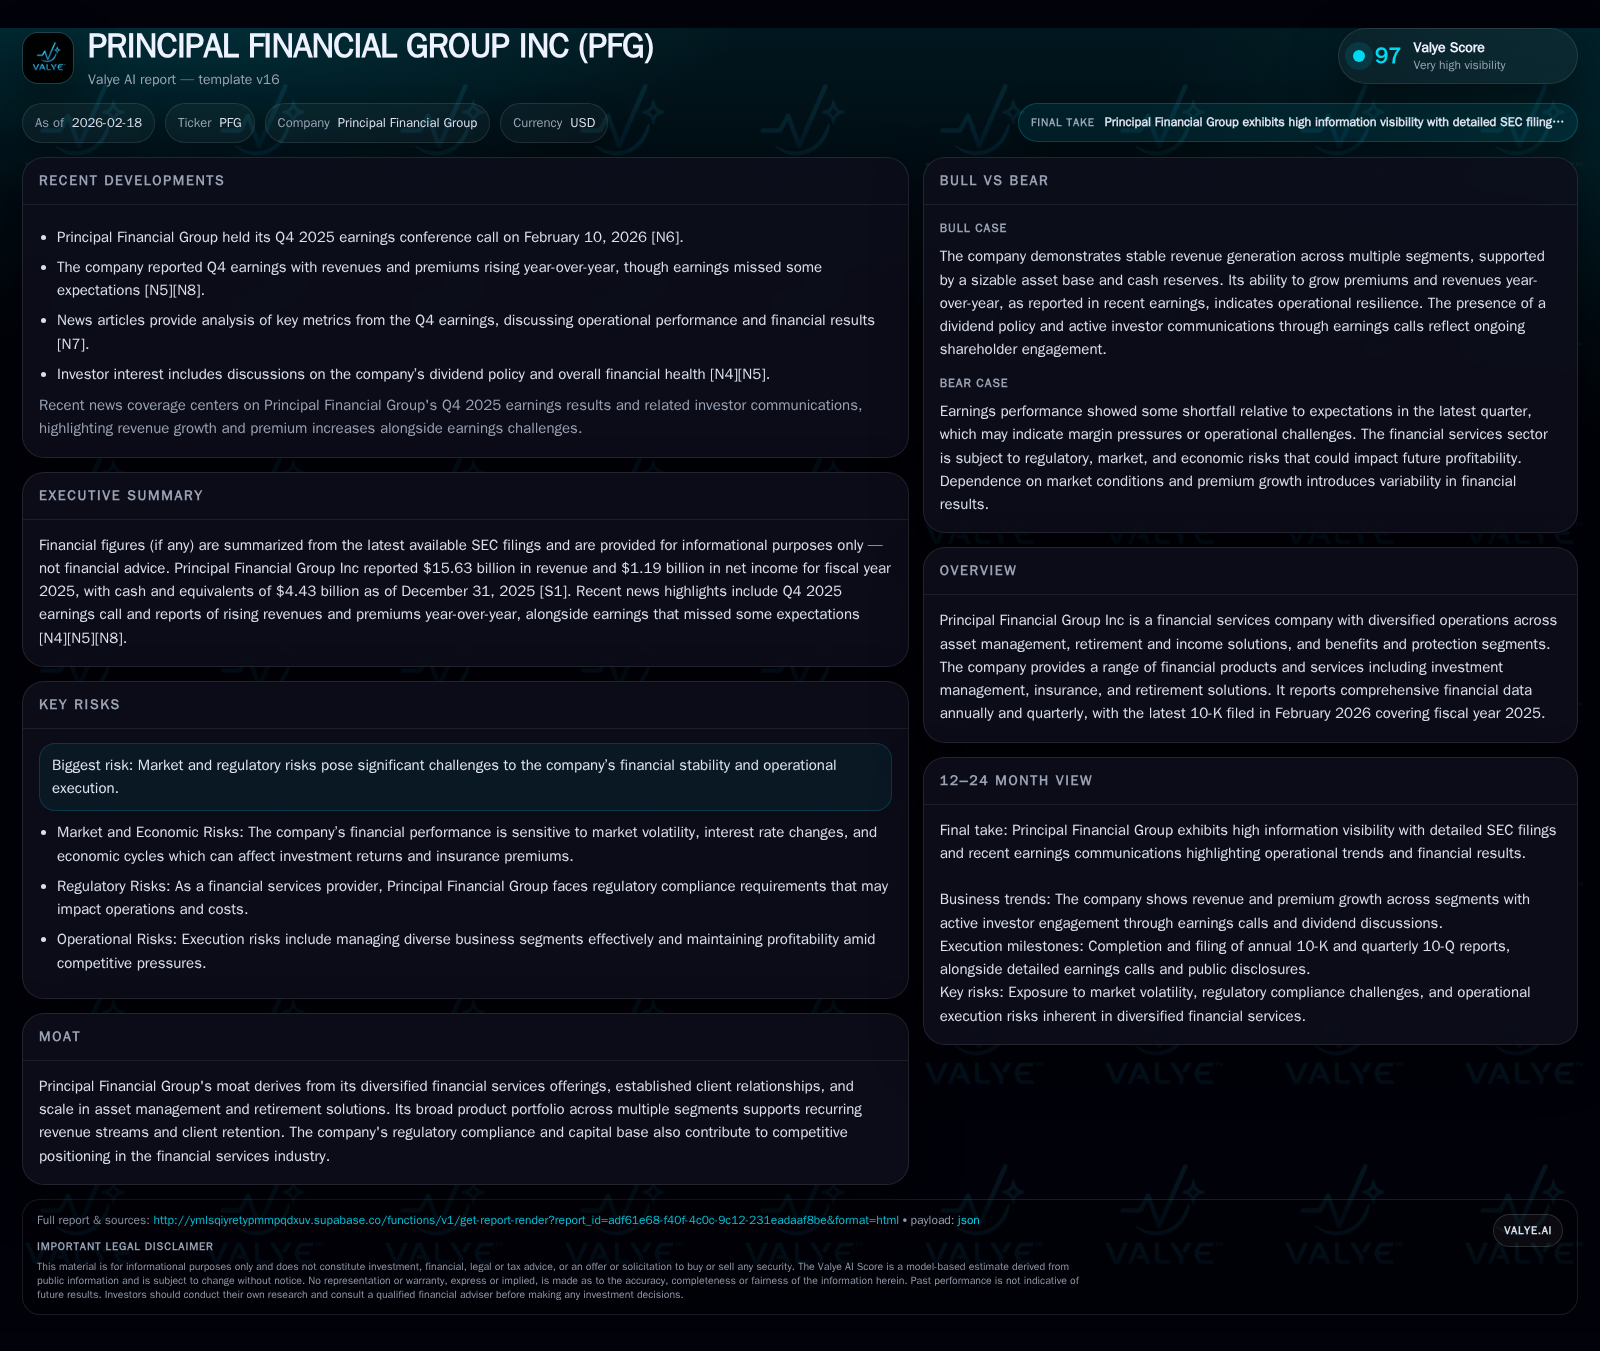
Principal Financial Group Inc experienced a -3.1% revenue decline in fiscal year 2025 following a rebound in 2024, with net income falling by -24.6%. The company's diversified operations across asset management, retirement, and insurance were impacted by competitive pressures and market volatility. Robust operating cash flows supported consistent dividend payments and share repurchase activity, signaling disciplined capital allocation despite earnings softness. Future growth depends on navigating regulatory complexities and market headwinds while leveraging demographic trends in retirement solutions.
Historical Performance Overview: Revenue and Profit Trajectory
Principal Financial Group’s fiscal years 2022 through 2025 reveal an undulating financial trajectory marked by a marked revenue compression post-peak levels in 2022. Revenues receded from $17.49 billion in 2022 down to $13.67 billion in 2023 — a steep decline of approximately -21.8%. This was followed by a significant rebound of +17.9% in 2024, lifting revenues to $16.13 billion before the latest fiscal year saw another moderate slip of -3.1%, closing at $15.63 billion [F1].
Net income trends amplify this volatility: from a lofty $4.81 billion in 2022, profits plummeted by more than 87% in 2023 to just $0.62 billion, before recovering sharply by over +150% to $1.57 billion in 2024 — ultimately falling again by nearly a quarter (-24.6%) to $1.19 billion in 2025 [F1]. Operating income metrics are not available from the provided tags, limiting deeper profitability analysis.
Historical performance (annual)
| FY | Rev ($bn) | Net ($bn) | CFO ($bn) | Rev YoY | Net YoY |
|---|---|---|---|---|---|
| 2025 | 15.6 | 1.2 | 4.5 | -3.1% | -24.6% |
| 2024 | 16.1 | 1.6 | 4.6 | +18.0% | +152.1% |
| 2023 | 13.7 | 0.6 | 3.8 | -21.9% | -87.0% |
| 2022 | 17.5 | 4.8 | 3.2 |
Note: Omitted columns lack sufficient annual XBRL coverage in the provided tags (need ≥2 annual points): OpInc, Capex, FCF. Source: SEC companyfacts cache [F1].
Capital returns and efficiency (annual)
| FY | Div ($mm) | Buybacks ($mm) | ROE% |
|---|---|---|---|
| 2025 | 684 | 903 | 10.0 |
| 2024 | 658 | 1042 | 14.2 |
| 2023 | 626 | 740 | 5.7 |
| 2022 | 642 | 1661 | 48.1 |
Source: SEC companyfacts cache [F1].
Note: Operating income and capital expenditures data are not available in provided tags.
Drivers Behind Revenue Decline and Net Income Variation
The modest revenue decline in FY25 contrasts with rising premiums reported during Q4, where management acknowledged premium growth but indicated earnings fell short of analyst expectations due to unfavorable hedging results and claims experience volatility [N4][N5]. Market disruption manifested through fluctuating asset valuations also weighed on realized gains within investment portfolios.
The company’s commentary underscored pricing challenges in competitive insurance markets alongside elevated claims severity that curbed underwriting margins despite top-line resilience from recurring fee income streams embedded within asset management [N4]. Strategic hedging efforts aimed at offsetting interest rate risks encountered headwinds as market dynamics shifted unexpectedly late-cycle.
Segment-Level Dynamics: Asset Management, Retirement Solutions, and Insurance
Segment disclosures reveal nuanced contributions shaping overall performance [S4][S6][S7]:
- Principal Asset Management: Scale advantages bolstered fee revenues amidst challenging markets; however, net inflows faced pressure linked to geopolitical uncertainties influencing client allocations.
- Retirement and Income Solutions: Faced headwinds from product mix shifts as demographic factors altered client preferences toward annuities versus lump-sum distributions; pension risk transfer transactions slowed relative to peak prior years.
- Benefits and Protection: Life insurance units experienced margin compression given heightened competition and claims inflation affecting underwriting profitability; specialty benefits maintained steadier trends but lacked significant volume drivers.
Client retention rates remain stable yet price sensitivity intensifies as corporate customers reassess benefit offerings under cost-containment agendas.
Risks Impacting Performance: Market Volatility and Regulatory Environment
Principal’s filings detail significant risk factors including compliance costs stemming from evolving capital requirements for insurers, litigation exposure related to underwriting practices, and macroeconomic uncertainties influencing discount rates used for policy reserves valuation [S5][S10]. Increased regulatory scrutiny around retirement product suitability standards adds complexity to product design agility.
Volatile fixed income markets impact reinvestment yields critical for annuity product economics while equity market swings affect asset management fee base stability — combining into layered operational risks demanding agile hedging and balance sheet management strategies.
Capital Allocation Focus: Dividends, Buybacks, and Cash Flows
Despite earnings softness, Principal demonstrated disciplined capital returns underpinned by robust operating cash flow near $4.54 billion in FY25 compared favorably with prior years [F1]. Dividends paid rose modestly to $684 million with incremental annual hikes aligned with a yield-supportive policy attractive amid sector peers [F1][N14].
Share repurchases continued but at slightly reduced scale versus FY24 ($903 million vs $1.04 billion), suggesting calibrated capital deployment responsive to current earnings variability while maintaining financial flexibility.
Return on equity approximates ~10%, reflecting moderate profitability given sector benchmarks yet constrained by recent income volatility [F1]. This balance exemplifies Principal’s conservative approach prioritizing liquidity amid external uncertainties.
Future Growth Outlook: Company-Specific Prospects and External Constraints
Management commentary signals cautious optimism anchored on long-term demographic trends favoring retirement income products due to aging populations across core markets [N10][N12][S1]. Yet regulatory complexity introduces growth caps through enhanced compliance burdens impacting product innovation speed especially within benefits solutions segments.
Innovation initiatives encompass digital transformation efforts targeting client engagement improvements; however, explicit forward guidance remains limited necessitating close monitoring of quarterly disclosures for sales traction or margin recovery signals.
Earnings Expectations and Market Sentiment Reflections
Post-Q4 reactions underline tempered investor sentiment given earnings misses despite top-line premium growth; analyst revisions have incorporated scenarios reflecting persistent margin pressures from claims inflation counterbalanced by stable fee-based revenues [N7][N8].
Market participants will likely focus on upcoming quarterly sales figures within retirement solutions alongside expense control effectiveness as critical barometers for re-rating potential.
Governance and Risk Management Amidst Industry Pressures
Disclosures affirm stable executive leadership with deep sector experience overseeing risk governance frameworks designed to handle heightened operational exposures amid shifting regulations [S1]. Independent audit opinions confirm internal control integrity ensuring reliable financial reporting against complex accounting environments typical for insurance-linked products.
Risk committees engage dynamically with emerging threats including cybersecurity vulnerabilities impacting customer data protection — increasingly vital as digital channels deepen business reliance.
Disclaimer: This analysis is for informational purposes only and does not constitute investment advice or recommendations.
Disclaimer: This is research-only, informational analysis and not investment advice. It may include AI-generated interpretation and general industry context. Always verify important details using primary sources.
Comments