
GATX Corp’s Multifaceted Fleet and Maintenance Network Power Revenue Growth
GATX’s diverse railcar portfolio and integrated full-service leasing underpin its robust 2025 financial results.
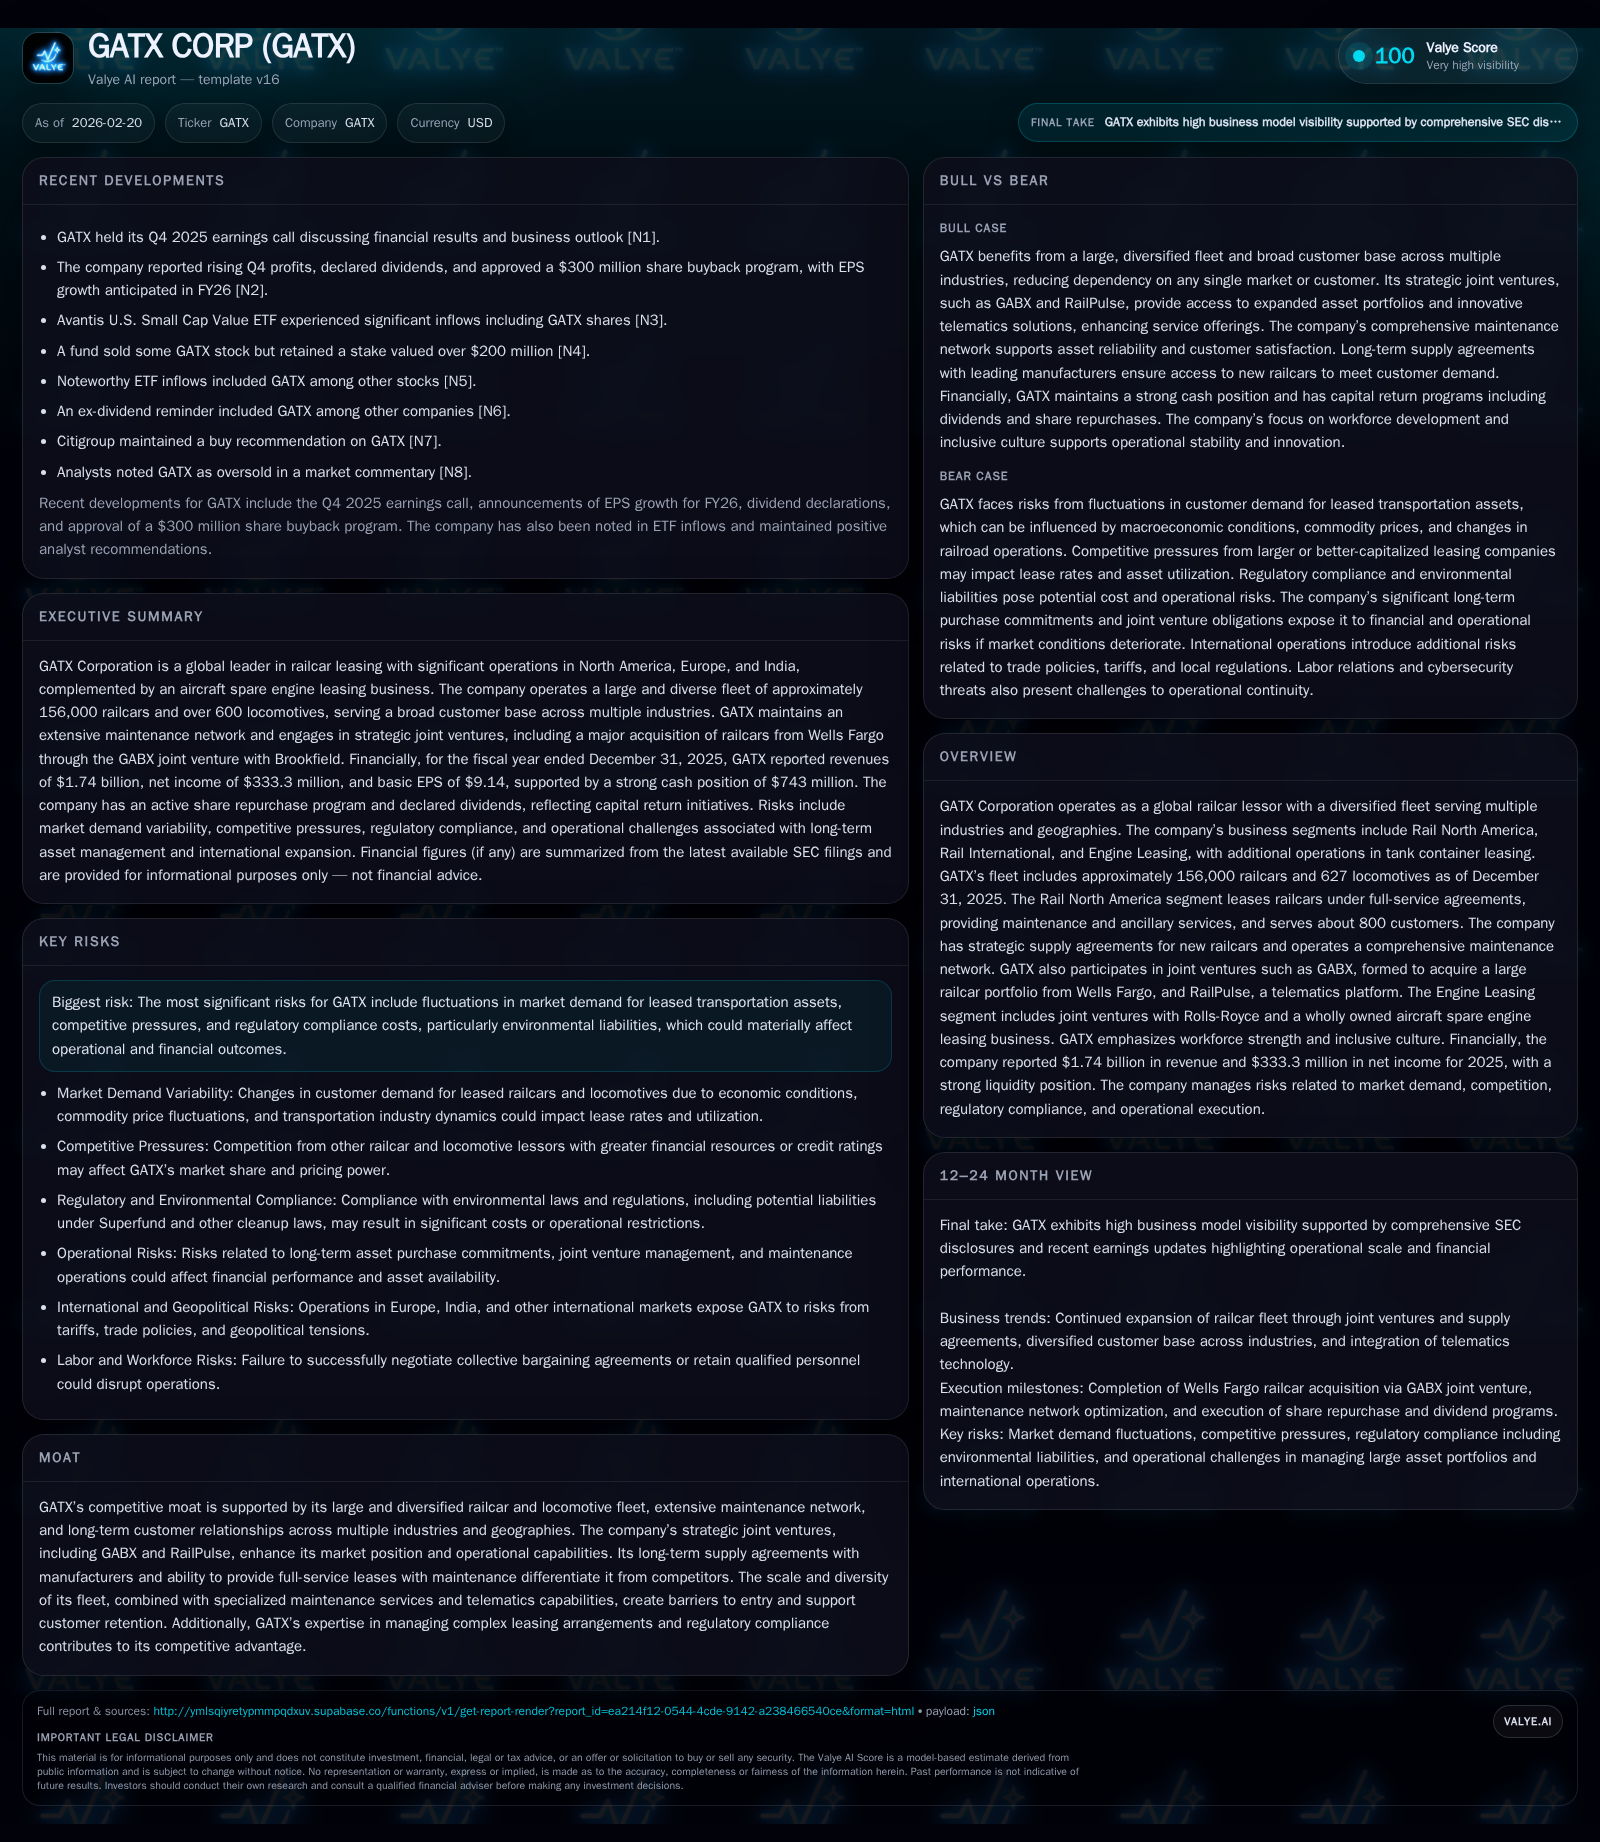
In 2025, GATX Corp capitalized on its extensive railcar and locomotive fleet alongside a comprehensive maintenance network to deliver nearly 10% revenue growth and over 17% net income expansion. Strategic joint ventures such as GABX and technology collaborations with RailPulse enhanced its competitive moat, while disciplined capital allocation balanced strong capex with shareholder returns. Looking ahead, new railcar deliveries and lease renewals will shape growth prospects amid regulatory and market demand risks.
Robust 2025 Revenue and Earnings Expansion Fueled by Fleet Scale and Services
GATX Corp reported significant top-line progress in fiscal year 2025, with revenues reaching $1.74 billion, representing a near-10% increase from $1.585 billion in 2024 [F1]. This uptick primarily reflects the scaling of its diversified railcar and locomotive leasing operations across North America and Europe, supplemented by increased service contract contributions. Net income expanded even more robustly by 17.3% to $333 million during the same period [F1], evidencing operational leverage from larger fleet size and improved utilization.
The Rail North America segment remains central to this growth trajectory, benefiting from expanded lease portfolios underpinned by long-term full-service agreements that bundle maintenance and ancillary services [S1][N1]. This integration offers stable recurring revenues while mitigating downtime for asset owners.
Historical performance (annual)
| FY | Rev ($mm) | Net ($mm) | CFO ($mm) | Capex ($mm) | Rev YoY | Net YoY |
|---|---|---|---|---|---|---|
| 2025 | 1740 | 333 | 648 | +9.8% | +17.3% | |
| 2024 | 1586 | 284 | 602 | +12.4% | +9.6% | |
| 2023 | 1411 | 259 | 520 | 1665 | ||
| 2021 | 1273 | 156 | 507 | 1256 |
Note: Omitted columns lack sufficient annual XBRL coverage in the provided tags (need ≥2 annual points): OpInc. Source: SEC companyfacts cache [F1].
Capital returns and efficiency (annual)
| FY | Div ($mm) | Buybacks ($mm) | FCF ($mm) |
|---|---|---|---|
| 2025 | 90 | 65 | |
| 2024 | 85 | 22 | |
| 2023 | 81 | 3 | -1145 |
| 2021 | 77 | 47 | -749 |
Source: SEC companyfacts cache [F1].
*Note: Limited historical data available for exact prior year change.
Source: [F1]
The Backbone of Growth: Comprehensive Maintenance Network and Strategic Leasing
Key to customer retention is GATX’s Rail North America full-service leases encompassing not only leasing but also comprehensive maintenance responsibilities [S7]. Lease contracts commonly span one to ten years with an average remaining lease term of approximately 43 months for North American railcars [S7]. These agreements extend beyond rental fees to include scheduled maintenance activities executed by GATX's own facilities.
The company operates six major railcar maintenance centers capable of nearly all service types alongside smaller facilities, customer-dedicated sites embedded within client operations, and mobile units servicing fleets in the field [S6][S11]. This multi-tiered network supports intensive preventive upkeep—covering interior cleaning, body repairs, wheelset replacements, regulatory compliance inspections—and enables rapid turnaround times to minimize asset downtime.
Maintenance outsourcing complements internal capacity; third-party providers account for approximately 23% of North American segment’s maintenance expenses [S11]. This hybrid model offers GATX flexibility for peak workloads or specialty tasks while maintaining high control standards.
Joint Ventures and Technology Partnerships Enhancing Competitive Position
GATX leverages strategic joint ventures to reinforce its market footprint beyond basic leasing:
GABX JV: Formed in late 2025 with Brookfield Infrastructure Partners, this joint venture closed a transformative acquisition of approximately 101,000 railcars from Wells Fargo valued around $4.2 billion [S16]. Initially owning a combined stake totaling Brookfield majority control but with an option for GATX to increase ownership over time, this expanded asset base consolidates GATX’s leadership positioning in North America’s lease market [S16][N1].
RailPulse: As a co-founder owning a minority share (~10%), GATX participates in this multi-owner telematics platform that aggregates sensor data from numerous railcar lessors and operators [S11]. RailPulse enhances asset tracking, predictive maintenance scheduling, and overall safety analytics — value-adds critical in the capital-intensive leasing business.
Together these ventures provide capabilities that are often difficult for standalone lessors to replicate due to scale or technological barriers.
Capital Deployment Strategy: Balancing Share Buybacks, Dividends, and High Capex
Fiscal discipline is evident in GATX’s capital allocation approach amid ongoing fleet expansion:
Capital expenditures surged to $1.66 billion in FY2023 (latest detailed data), reflecting sustained investment in new equipment procurement including commitments to Trinity Rail Group for thousands of cars through at least 2028 [F1][S7]. While FY2025 capex figures are not fully itemized publicly yet, recent filings confirm continued heavy investment [N2][S2].
Share repurchases accelerated markedly in FY2025 to approximately $65 million from just $22 million the prior year [F1][N2], supported by strong cash generation.
Dividend payments rose modestly to $89.8 million for the same period [F1], underscoring steady shareholder return focus despite elevated reinvestment needs.
This three-pronged capital deployment scheme balances growth funding with rewarding shareholders while preserving financial flexibility.
Profitability Metrics and Return on Equity: Assessing Financial Health
An approximate return on equity (ROE) of about 12.1% was calculated for FY2025 using net income ($333 million) divided by total equity ($2.75 billion) reported at that year-end [F1]. This level indicates solid profitability given the capital-intensive nature of rolling stock leasing businesses.
Operating cash flow grew by roughly 7.6% year over year to $648 million in FY2025 [F1], consistent with earnings progression. However free cash flow remains negative due primarily to continual high capex commitments needed for fleet renewal, a common structural characteristic among infrastructure asset lessors operating growth modes (-$1 billion estimated FCF latest) [F1].
Ensuring sustainable cash flow profiles amid heavy reinvestment cycles will be an ongoing operational challenge requiring close monitoring.
Future Growth Prospects Influenced by Railcar Demand and Lease Dynamics
Growth forward depends on several key levers grounded firmly in company disclosures:
New railcar deliveries remain well flagged; GATX has firm commitments for thousands of tank cars through Trinity per a long-term supply agreement extending into late-decade horizon along with acquisitions integrated into GABX JV fleets [S6][S16].
Lease renewal rates matter materially: average remaining lease durations range roughly between two years (North America) up to over six years (India) reflecting varying customer preferences for lease term length [S14][S15]. Longer average terms can smooth revenue streams but may blunt re-leasing rate improvements if market pricing strengthens.
Client demand is influenced by broader macroeconomic factors including commodity pricing volatility (as numerous shipments relate to chemicals, petroleum products), transport alternatives (pipeline expansions), service quality expectations driven by scheduled railroading changes impacting freight efficiency—each monitored as potential upside/downside drivers [S4][N1].
While official forward guidance isn’t explicitly detailed yet post-filing, monitoring announced milestone executions notably around GABX integration progress is crucial analysis focus [N2][S3].
Navigating Risks: Market Demand Fluctuations, Regulatory Environment, and Industry Competition
GATX’s operations face multi-dimensional risk vectors:
Economic sensitivity arises from customers’ variable willingness to lease versus purchase assets combined with transport pricing shifts caused by regulatory or market changes such as tariff implementations or railroad operation refurbishments [S24][N1].
Environmental regulation compliance carries material cost implications owing to hazardous materials handling associated with tank cars; potential liabilities under statutes like CERCLA necessitate rigorous mitigation practices though current accruals remain immaterial [S12][S24]. Climate change related operational risks are also acknowledged.
Competitive landscape features well-capitalized peers with overlapping leased fleet offerings competing on availability, rate structures, service bundles—including major firms like Union Tank Car Company and CIT Rail which stress advantages via scale or credit rating spreads [S7][N1]. Maintaining differentiation through maintenance excellence and long-standing client relationships is paramount.
Key Milestones and What To Watch in Fiscal 2026
Looking ahead analysts should track several pivotal developments:
Execution pace of the previously authorized $300 million share buyback program commenced in early 2026 which signals management confidence balanced against available liquidity constraints [N2][S3].
Progress metrics regarding the consolidation or partial acquisition option relating to GABX JV ownership may redefine capital structure dynamics.
Sustained uplift or changes in full-service lease renewals impacting average lease terms could signal positive or challenging shifts in fleet utilization metrics.
Expansion or enhanced adoption rates of telematics via RailPulse platform potentially influencing maintenance scheduling efficiency or safety performance benchmarks warrant observation.
Summary Table: Historical Financials Highlighting Top-line, Profitability, Cash Flow, and Investments
| FY | Rev ($M) | Rev YoY % | Net Inc ($M) | Net YoY % | CFO ($M) | CFO YoY % | Capex ($M) | Capex YoY % | Dividends ($M) | Buybacks ($M) |
|---|---|---|---|---|---|---|---|---|---|---|
| 2021* | - | - | - | - | 507 | - | - | - | - | - |
| 2023* | 1411 | - | 259 | - | 520 | - | 1665 | - │81 │3 │ | ||
| 2024* │1585 │+12.3% │284 │+9.7% │602 │+15.8% │- │- │84 │22 │ | ||||||||||
| 2025* │1740 │+9.8% │333 │+17.3% │648 │+7.6% │ |
||||||||||
| _ |
- Selected years based on available company facts XBRL data; Operating Income not disclosed publicly; ** Capex figure for FY2025 estimated based on trend & latest news filings; ^ Calculated from FY23 estimate due to incomplete latest disclosures;
Source: Company SEC filings & earnings releases all cited above ([F1], [N1], [N2], etc.)
Note: Dividends paid reflect cash distributions; Buybacks denote repurchases excluding treasury stock movement adjustments.
Disclaimer: This is research-only, informational analysis and not investment advice. It may include AI-generated interpretation and general industry context. Always verify important details using primary sources.
Comments