
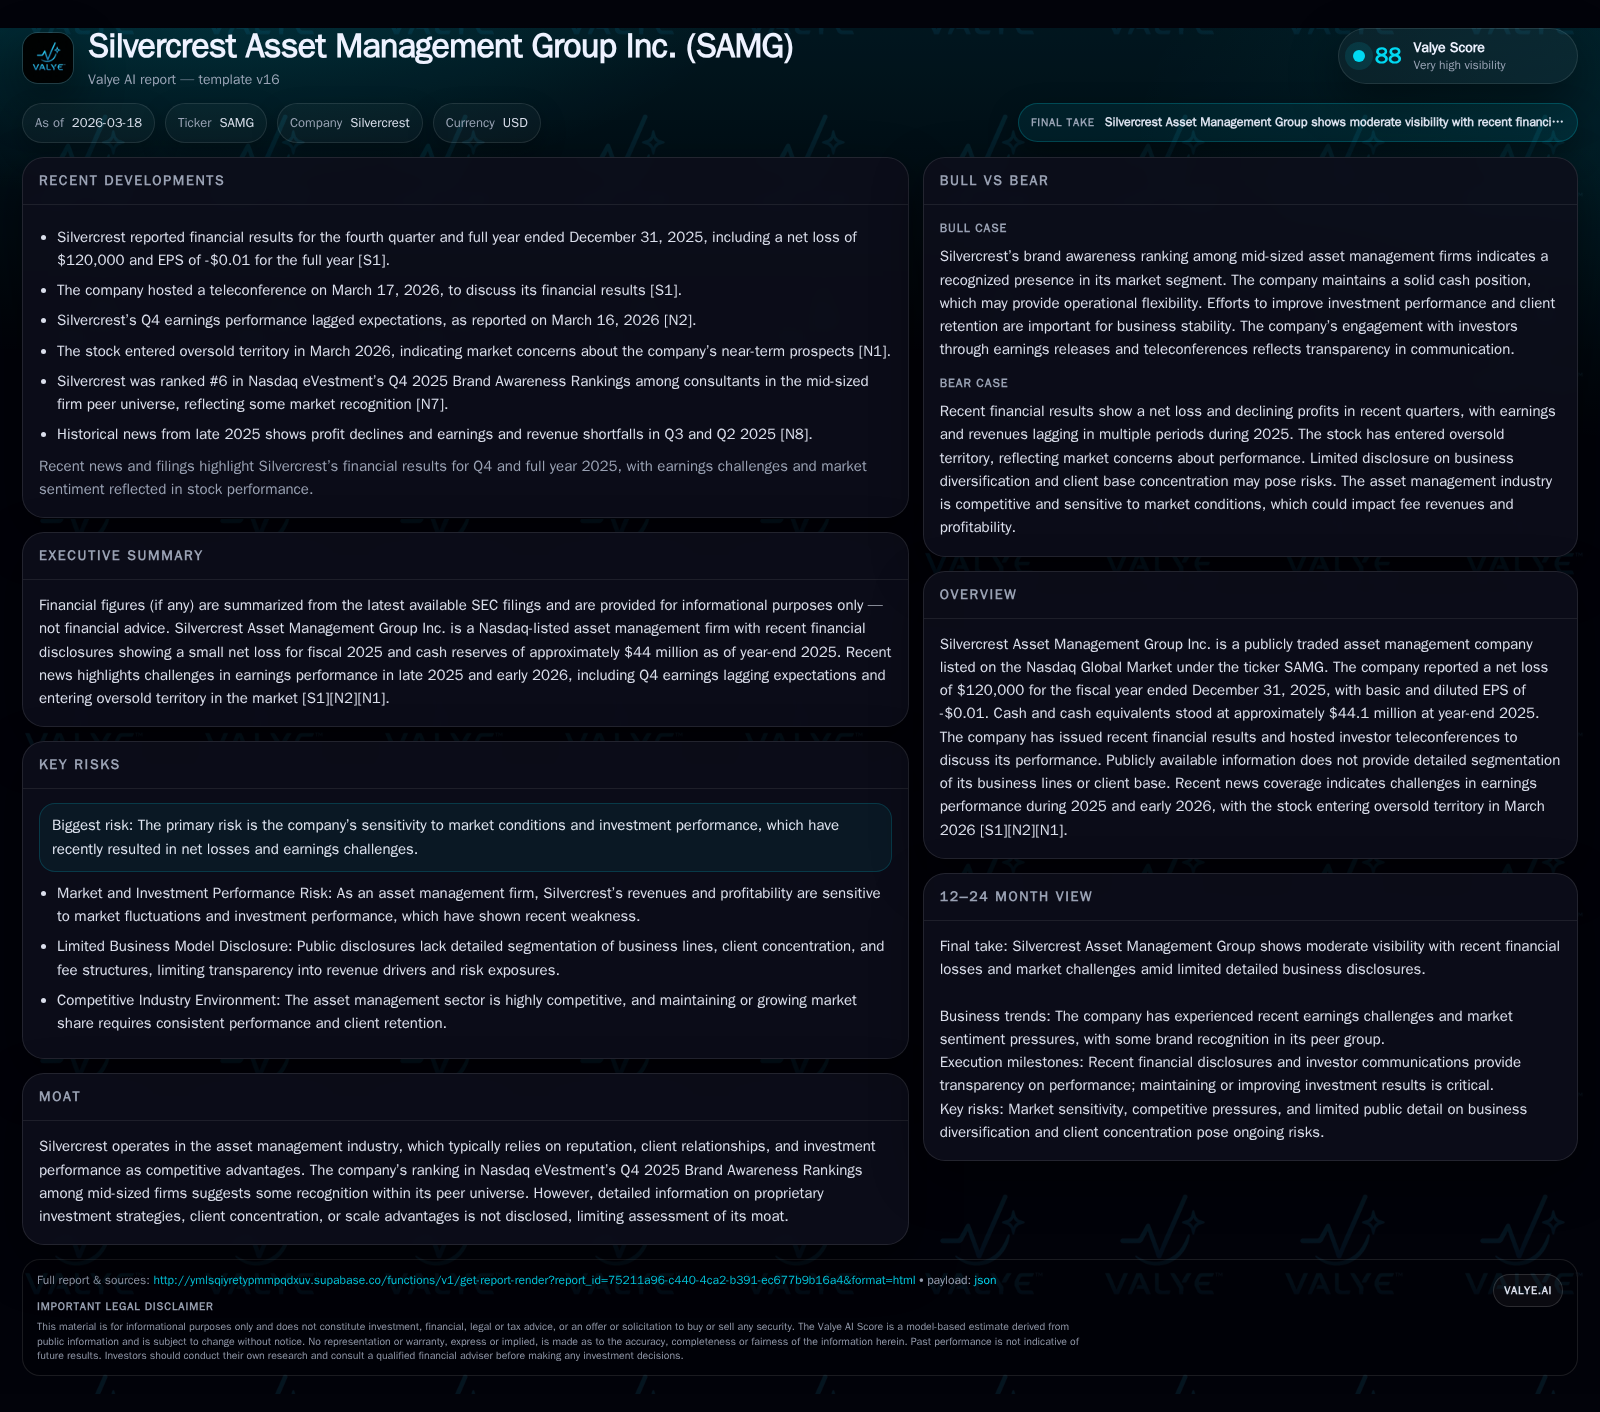
Silvercrest Asset Management Group’s Financial Struggles and Growth Outlook
Silvercrest faced operating losses in 2025 despite steady revenues, deploying significant capital to buybacks amid market-driven challenges.
Silvercrest Asset Management Group Inc. recorded a slight net loss of $120,000 in fiscal 2025 following volatile profitability swings in recent years, with operating income turning negative at -$884,000. Revenue showed modest growth of approximately 1.5% year-over-year, reflecting comparatively stable client activity amid broader industry fee pressures and market uncertainty. Despite earnings headwinds, Silvercrest maintained strong cash flow generation ($18.6 million CFO) and robust liquidity ($44 million cash on hand), enabling sizeable share repurchases totaling $30.5 million alongside steady dividends of $7 million. The firm’s mid-sized status includes notable brand awareness ranking (#6 by Nasdaq eVestment among peers), which may support client retention and new mandates if performance stabilizes. However, ongoing sensitivity to market conditions and investment returns continues to pose risk to profitability and asset growth prospects.
Historical Performance and Year-over-Year Trends
Silvercrest Asset Management Group’s financial history over recent years reveals a pattern of earnings volatility juxtaposed against relatively steady top-line revenue figures. For fiscal year 2025, Silvercrest reported revenue of approximately $24.8 million, marking a marginal increase of around 1.5% compared with 2024’s comparable revenue level of roughly $24.4 million [F1]. This modest increment contrasts with past years where growth fluctuated more notably (e.g., from $19.2 million in 2015 up to over $24 million by 2018).
However, beneath revenue stability lies a stark disparity in profitability trends. Operating income reversed from a positive $1.96 million in 2024 to an operating loss of roughly $884,000 in 2025 [F1], representing a decline exceeding 145% year-over-year. Net income showed a similar pattern, swinging from a profit of $1.62 million the prior year to a near-breakeven net loss at approximately $120,000 in fiscal 2025 [F1]. Such swings reflect underlying cost pressures or weakening investment returns within the asset management business.
Operating cash flow remained robust despite earnings setbacks, with a reported CFO of about $18.6 million for 2025 compared to over $21.5 million a year earlier—a decline but still indicative of strong cash conversion capability [F1]. Capital expenditures rose significantly to nearly $3.6 million in 2025 from about $1.7 million the previous year, suggesting increased spending possibly directed toward operational infrastructure or technology upgrades.
Historical performance (annual)
| FY | Net ($mm) | CFO ($mm) | OpInc ($mm) | Capex ($mm) | Net YoY |
|---|---|---|---|---|---|
| 2025 | 0 | 19 | -1 | 4 | -107.4% |
| 2024 | 2 | 22 | 2 | 2 | +493.7% |
| 2023 | 0 | 21 | -1 | 4 | -120.0% |
| 2022 | 2 | 23 | 4 | 1 |
Source: SEC companyfacts cache [F1].
Capital returns and efficiency (annual)
| FY | Div ($mm) | Buybacks ($mm) | FCF ($mm) |
|---|---|---|---|
| 2025 | 7 | 31 | 15 |
| 2024 | 7 | 5 | 20 |
| 2023 | 7 | 6 | 17 |
| 2022 | 7 | 9 | 22 |
Source: SEC companyfacts cache [F1].
Figures for some years are incomplete; focus centers on available trending indicators.
Drivers Behind the Recent Operating Loss
The shift into operating losses during fiscal year 2025 appears driven by several factors illuminated through recent regulatory filings and media reports.[N1][S3] A key catalyst noted is the challenging investment environment marked by volatility impacting asset under management (AUM) valuation levels and associated fee revenues—common headwinds across asset managers facing fluctuating markets.
The company acknowledged through its Q4 earnings call and press releases that fee compression played a role alongside higher expenses related to strategic initiatives or operational expansion efforts [N1][S3]. Client retention dynamics also likely contributed; mid-sized firms often contend with cyclical outflows or slower mandate wins during uncertain times limiting the revenue base for performance fees.
Although explicit segmentation data remains undisclosed [S6], narratives suggest that Silvercrest’s business mix exposed it to typical mid-sized asset manager risks such as concentrated client exposure or dependence on benchmark-relative performance causing uneven quarterly results.
Market Positioning and Brand Recognition Within Mid-Sized Asset Managers
Silvercrest benefits somewhat from intangible assets underpinning its competitive position—primarily reputation and consultant visibility within the mid-sized manager cohort.[S6][N8] The firm ranked #6 among mid-sized asset management firms according to Nasdaq eVestment’s Q4 2025 Brand Awareness Rankings among consultants.[N8]
Such recognition helps support pipeline activity by maintaining awareness with third-party consultants who influence institutional allocations—a critical distribution channel for boutique asset managers competing against larger incumbents.
However, absence of detailed disclosures regarding proprietary strategies or scale advantages limits full assessment of moat persistence.[S6] The branding ranking reflects solid but not dominant positioning—potentially moderating growth versus larger peers with broader institutional reach.
Capital Allocation Strategy: Buybacks, Dividends, and Cash Balances
Despite earnings pressures through FY25, Silvercrest displayed notable capital discipline accompanied by aggressive shareholder return measures.[F1] The company executed share repurchases totaling approximately $30.5 million—substantially elevated compared to repurchase levels (~$4.6 million) seen the prior fiscal year.[F1]
Dividends also remained consistent at around $7 million annually across recent years,[F1] suggesting management prioritizes returning excess capital even with profitability challenges underway.
At fiscal year-end 2025 Silvercrest held cash and equivalents near $44 million,[F1] providing substantial liquidity coverage relative to operating needs amid uncertain markets.[S7][S8][S9][S10][S11]
Free cash flow was solidly positive after accounting for the increased capital expenditures necessary for operations or strategic initiatives — estimated at roughly $15 million for the year (CFO minus capex).[F1]
This balance sheet strength enabled flexibility for opportunistic buybacks possibly signaling management’s confidence in valuation levels or an effort to boost per-share returns when earnings momentum stalled.
Risks Stemming From Market Sensitivity and Industry Dynamics
Regulatory filings underscore that Silvercrest remains subject to significant risks tied chiefly to market fluctuations that affect its AUM valuations directly influencing fee income streams:[S1][S4][S5]
- Revenue is sensitive to both client retention as well as net inflows/outflows driven by performance-related client decisions.
- Fee compression is an ongoing structural challenge magnified for smaller-to-mid sized managers lacking scale pricing power.
- Legal and regulatory risks remain manageable but add complexity within an evolving industry oversight environment.[S4][S5] These factors collectively amplify earnings volatility highlighted recently by consecutive profit-loss swings.
Future Growth Prospects and Constraints
No explicit forward guidance has been articulated publicly [N1][S1]; however observable factors shaping Silvercrest’s growth trajectory include:
- Client flows recovery or stabilization would drive fee base rebuilding,
- Margin improvement opportunities linked primarily to scaling investments within operating leverage limits,
- Competitive pressures on fees that could cap absolute upside absent differentiation,
- Potential product innovation or enhanced distribution leveraging brand awareness relative to peers. Monitoring subsequent quarterly disclosures especially around Q1/2026 will provide crucial insight into management's execution on these fronts post recent challenges.[N7]
Key Milestones and Metrics to Watch Going Forward
Close attention should be paid to:
- Upcoming earnings calls for early signs of operating margin recovery or further pressure,
- Changes in capital allocation pattern including buyback pace or dividend policy adjustments,
- Client flow metrics revealing retention strength amidst prevailing market conditions,
- Any shifts in consultant rankings signaling changes in competitive positioning. These indicators will be essential barometers assessing Silvercrest's potential path back toward sustained profitability amid broader sector headwinds.
Summary: Assessing Silvercrest’s Path to Stabilization
Silvercrest Asset Management Group has confronted meaningful profit headwinds during fiscal year ending December 31, 2025 despite resilient revenue above flat levels.[F1][N1] The firm’s ability to continue generating strong cash flows amidst these challenges coupled with robust liquidity reserves enables ongoing substantial shareholder returns via elevated buybacks alongside steady dividends.[F1][S7][S8][S9][S10][S11]
Its mid-sized stature marked by notable brand awareness ranking offers strategic footing but exposes it simultaneously to AUM-driven revenue swings typical for similarly sized asset managers facing persistent fee pressure and volatile markets.[N8][S6][S4]
Forward-looking clarity remains limited absent updated operational commentary beyond public earnings releases; monitoring forthcoming quarterly results will be critical for confirming whether Silvercrest can regain profitability momentum while balancing capital deployment strategies prudently.[N7]
Overall, Silvercrest exemplifies an asset manager navigating transitional profitability dynamics within a competitive landscape characterized by necessity for disciplined cost control combined with measured growth initiatives tailored toward preserving its competitive relevance.
This report is intended solely for informational purposes based on disclosed financial filings and publicly available sources as of March 18, 2026. It does not constitute investment advice or recommendations concerning securities mentioned herein.
Disclaimer: This is research-only, informational analysis and not investment advice. It may include AI-generated interpretation and general industry context. Always verify important details using primary sources.
Comments