
Star Bulk Carriers Reports Revenue Decline and Boosts Fleet Investments Amid Market Softness
Star Bulk’s 2025 results show a 17.6% revenue drop offset by increased capital spending on energy-saving upgrades and diversified charter strategies to sustain operations and liquidity.
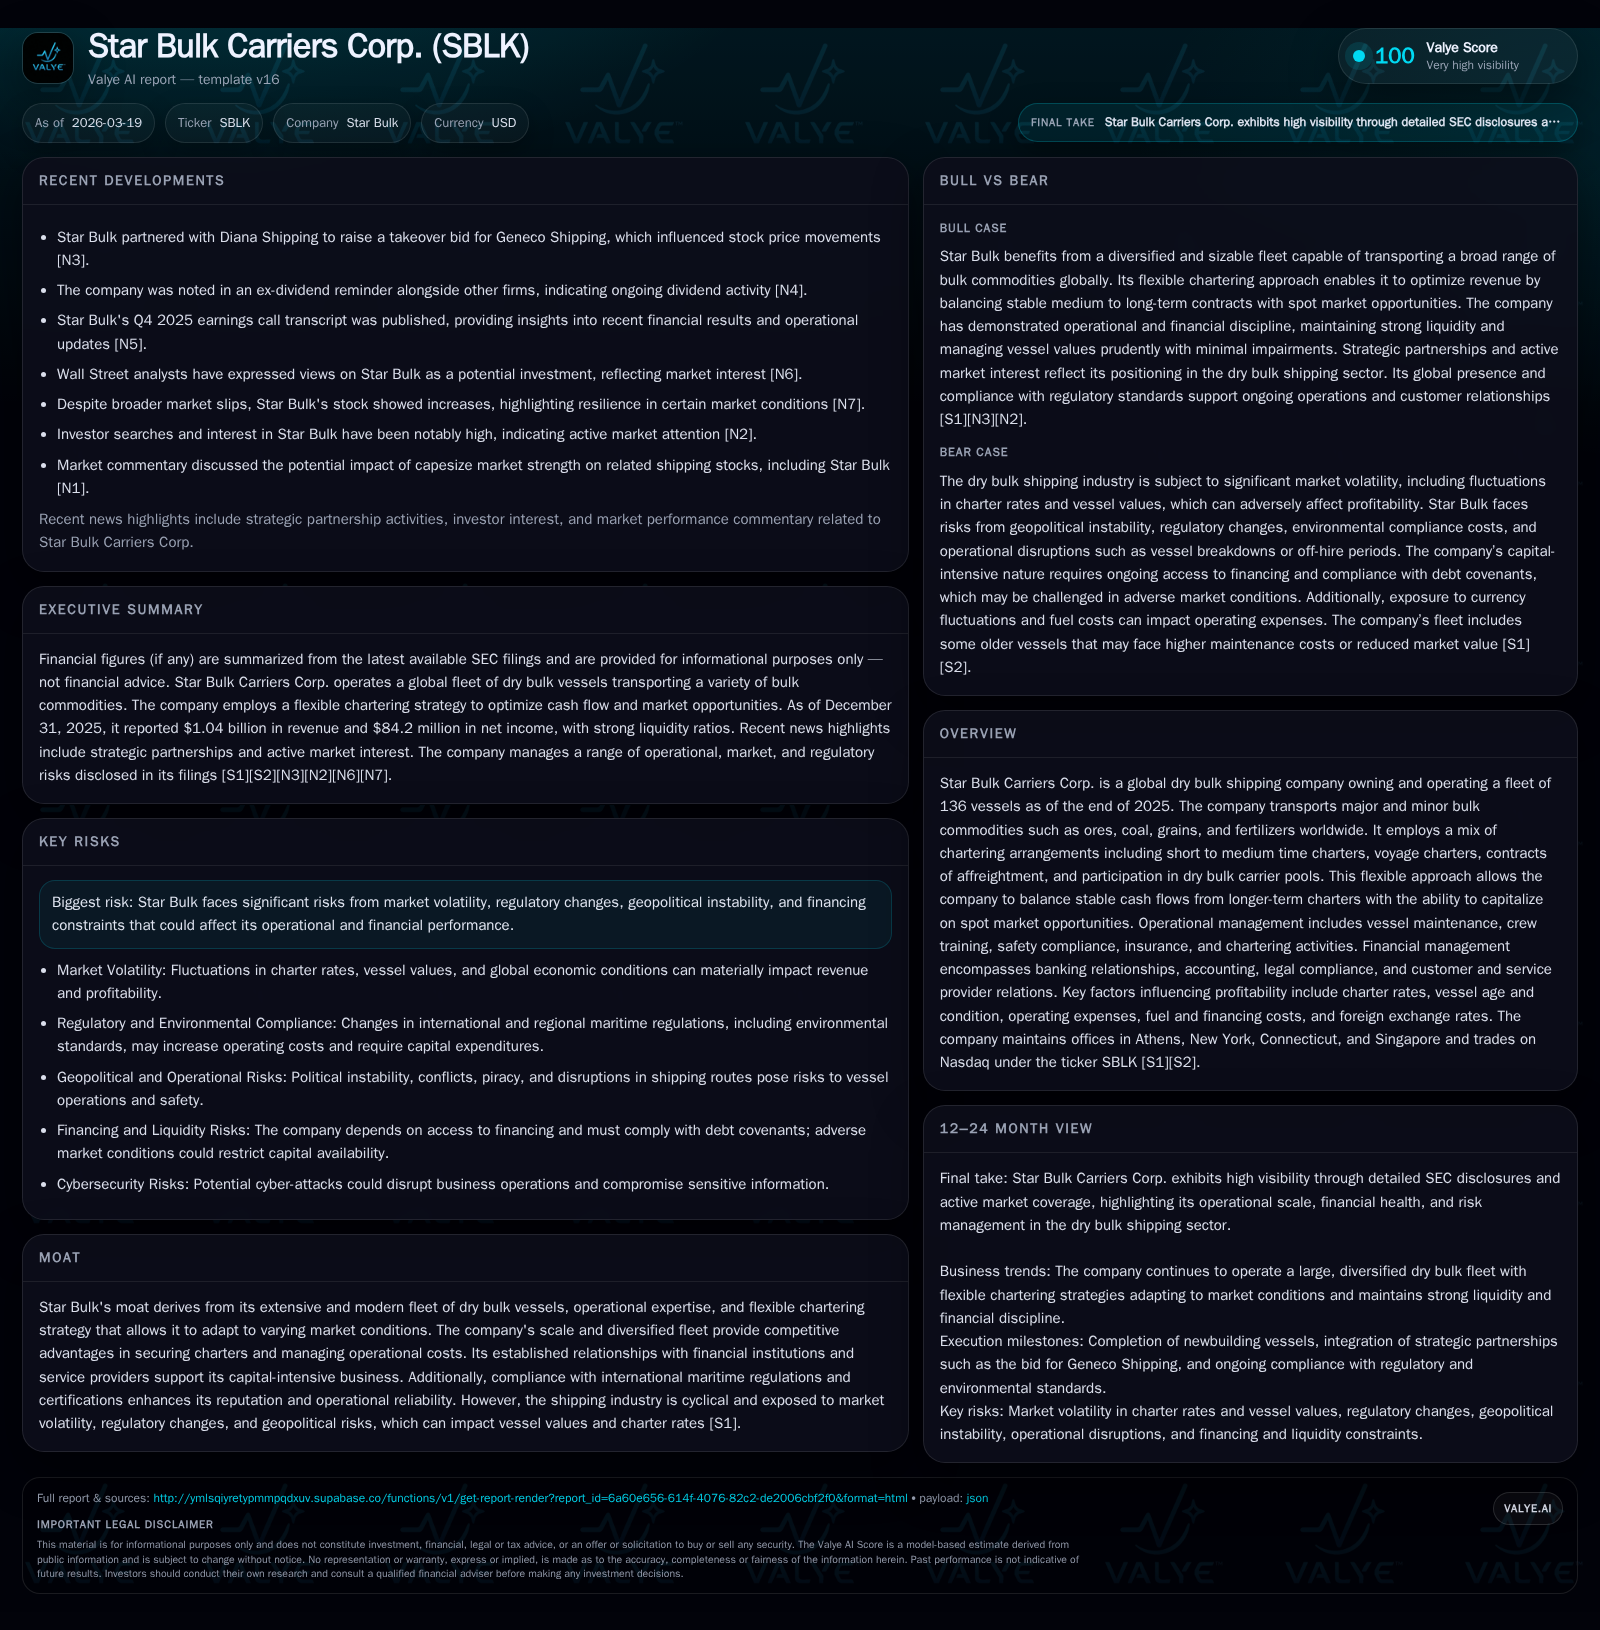
In 2025, Star Bulk Carriers Corp. reported a 17.6% decline in revenues to $1.04 billion and a 72.4% decrease in net income to $84 million compared to 2024, driven by softer charter rates and subdued vessel valuations. The company strategically managed its fleet through a blend of short- to medium-term charters, voyage charters, contracts of affreightment, and pooling arrangements to maintain utilization amid market volatility. Capital expenditures increased by over 50% year-over-year to nearly $84 million, focusing on Energy Saving Devices and upgrades aligned with regulatory compliance. With liquidity supported by $489 million in cash and equivalents and access to revolving credit and loan facilities, Star Bulk sustained operating cash flow of $296 million. Shareholder returns included $34 million in dividends and $98 million in share repurchases. The company highlighted ongoing risks including freight rate fluctuations, geopolitical uncertainties, regulatory changes, and integration costs related to recent mergers. Operational rigor continues with comprehensive safety, crew training, and cybersecurity governance frameworks.
Revenue and Profitability Overview
Star Bulk reported revenues of approximately $1.04 billion for fiscal year 2025, down 17.6% from $1.27 billion in 2024 [F1]. This decline primarily reflects softer dry bulk spot market conditions impacting average charter rates across the fleet. Operating income fell sharply by 64.3% to $137 million from nearly $383 million in the prior year, while net income declined by 72.4% to about $84 million [F1]. Despite this downturn, the company maintained conservative vessel valuation practices; only two vessels out of the fleet had carrying values exceeding market values by a minimal aggregate amount ($0.3 million), underscoring prudent impairment policies during persistent sector volatility [S1].
Fleet Operations and Chartering Strategy
As of December 31, 2025, Star Bulk operated a fleet of 136 dry bulk vessels transporting commodities such as ores, coal, grains, and fertilizers globally [S1], [S10]. The company employs a diversified chartering approach incorporating short- to medium-term time charters, voyage charters, contracts of affreightment (COAs), and participation in dry bulk carrier pools [S10]. This mix balances the stable cash flows associated with longer-term charters against flexibility to capitalize on spot market opportunities during favorable cycles.
The relatively young fleet includes modern Kamsarmax vessels equipped with energy-saving technologies that enhance operational efficiency and compliance with evolving environmental regulations [S3], [F1]. Pooling arrangements further optimize utilization rates critical in the cyclical dry bulk shipping sector.
Capital Structure and Liquidity Position
Star Bulk maintained strong liquidity entering 2026 with cash and equivalents totaling approximately $489 million against current liabilities near $384 million (current ratio ~1.78) [F1]. The company has access to revolving credit facilities aggregating about $115 million plus a dedicated loan facility up to $130 million for financing vessels under construction or recently delivered [S3], [S4].
Capital expenditures rose over 50% year-over-year reaching nearly $84 million in 2025 from $55 million in the prior year [F1]. Investments focused on installing Energy Saving Devices (ESDs), telemetry equipment for operational monitoring, and other upgrades essential for fuel efficiency improvements and compliance with international maritime standards [S3], [S12].
The early termination of interest rate swaps generated gains around $0.8 million during the year aiding interest cost management amid rising rates [S3]. Refinancing efforts aim at maintaining covenant compliance while optimizing capital costs amid volatile financial markets.
Financial Returns and Cash Flow Analysis
Return on equity contracted to approximately 3.4% in fiscal year 2025 as net income decreased while equity capital remained elevated at about $2.45 billion following merger-related expansions [F1]. Operating cash flow declined by roughly 37%, totaling about $296 million but remained sufficient to generate free cash flow estimated at around $212 million after accounting for capex [F1].
Dividend payments were reduced significantly from prior years—approximately $34 million paid versus over $277 million in 2024—reflecting earnings pressures while preserving liquidity [F1], [S12]. Conversely, share repurchases increased markedly to over $98 million in fiscal 2025 compared with modest buybacks previously, indicating management’s opportunistic approach amid share price levels below intrinsic vessel liquidation values [F1], [S12].
Outlook: Risks and Strategic Considerations
Star Bulk highlights ongoing exposure to freight rate volatility driven by macroeconomic factors including geopolitical tensions impacting trade flows as well as regulatory changes such as decarbonization mandates that may increase operating costs [S2], [S19]. The company also acknowledges potential integration costs or delays related to its merger with Eagle Bulk Shipping which could affect expected synergies [S2]. Analysts present mixed views on sector prospects with optimism around capesize vessel demand contrasted by potential softness in smaller segments due to shifting commodity patterns [N6], [N7]. Currency fluctuations remain an additional factor influencing cost structures.
Operational Excellence: Safety Compliance and Cybersecurity Governance
Beyond financial metrics, Star Bulk maintains rigorous operational standards aligned with ISM/ISPS safety codes complemented by continuous crew training programs via its ship management affiliates ensuring high competency levels [S1], [S21]. Regular vessel surveys uphold class certifications without restrictive notations—a prerequisite for insurance underwriting.
Cybersecurity is overseen by specialized IT service providers with extensive experience managing incident prevention and mitigation validated through ESG Committee governance reporting directly to the Board of Directors [S1]. This multi-layered approach addresses evolving risks from cyber threats alongside environmental-social governance expectations.
Historical Financial Performance Summary (FY2022–FY2025)
Historical performance (annual)
| FY | Rev ($mm) | Net ($mm) | CFO ($mm) | OpInc ($mm) | Rev YoY | Net YoY |
|---|---|---|---|---|---|---|
| 2025 | 1042 | 84 | 296 | 137 | -17.6% | -72.4% |
| 2024 | 1265 | 305 | 471 | 383 | +33.3% | +75.5% |
| 2023 | 949 | 174 | 336 | 238 | -33.9% | -69.3% |
| 2022 | 1437 | 566 | 770 | 608 |
Source: SEC companyfacts cache [F1].
Capital returns and efficiency (annual)
| FY | Div ($mm) | Buybacks ($mm) | FCF ($mm) |
|---|---|---|---|
| 2025 | 34 | 98 | 212 |
| 2024 | 277 | 25 | 416 |
| 2023 | 158 | 393 | 318 |
| 2022 | 668 | 20 | 744 |
Source: SEC companyfacts cache [F1].
Table reflects revenue contraction linked to dry bulk cycle downturns; capex increase driven by technology upgrades.
This analysis is based exclusively on publicly available filings including Forms 20-F and Form 6-K reports through March 19, 2026 ([F1], [S#]) alongside relevant news transcripts ([N#]). It provides a fact-based overview without investment recommendations or speculative forecasts.
Disclaimer: This is research-only, informational analysis and not investment advice. It may include AI-generated interpretation and general industry context. Always verify important details using primary sources.
Comments