
Sol-Gel Technologies Accelerates Revenue Growth Amid Ongoing Clinical Investment and Liquidity Challenges
SLGL shows marked revenue expansion driven by licensing agreements, while net losses narrow with sustained R&D investment.
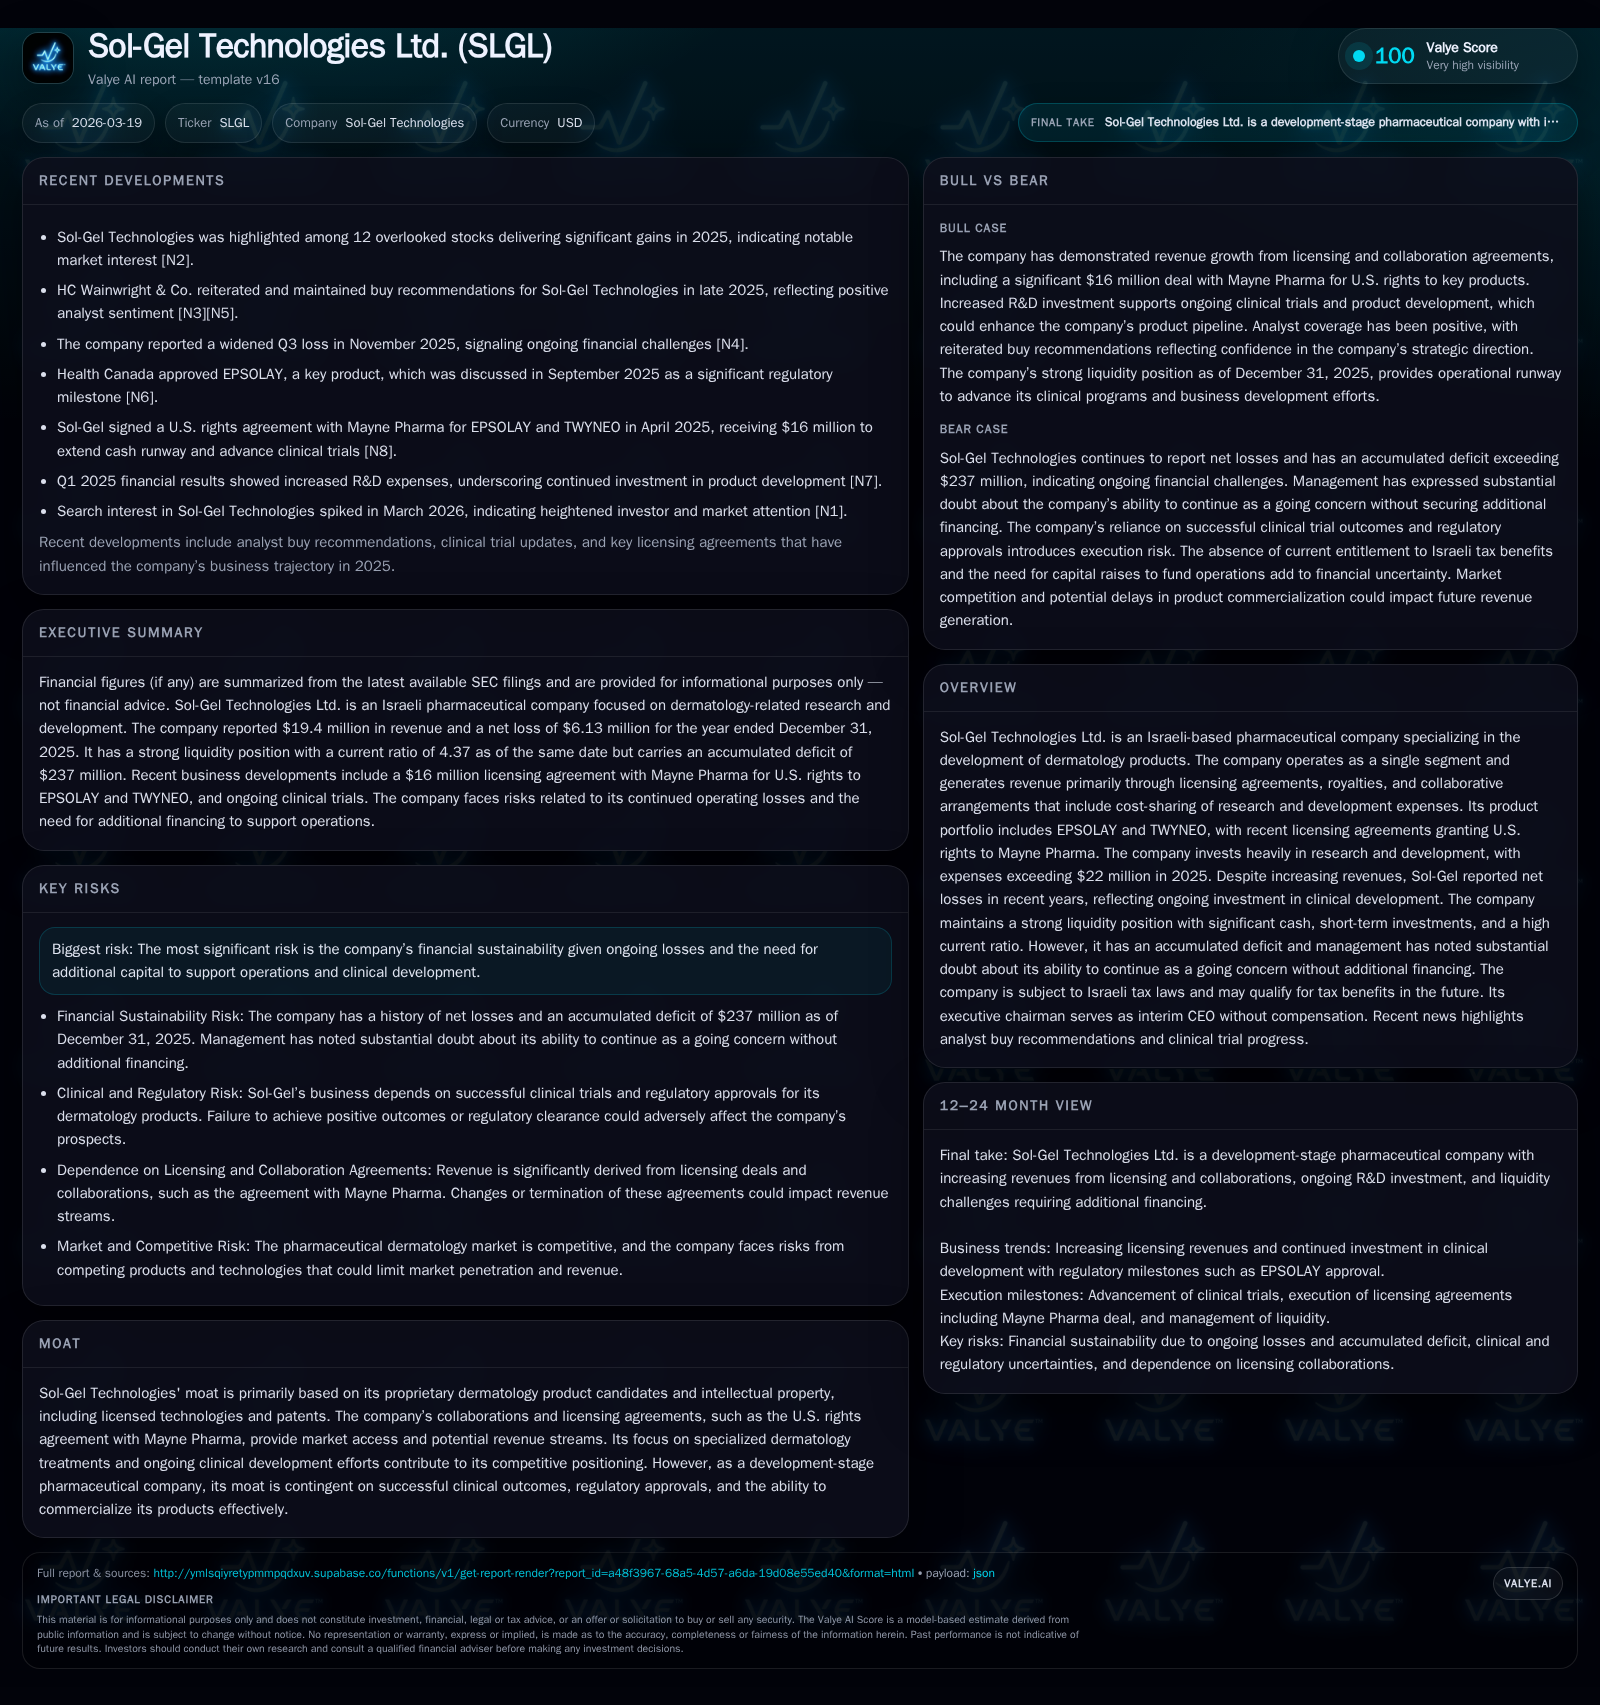
Sol-Gel Technologies Ltd., an Israeli pharmaceutical company specializing in dermatology products, achieved significant top-line growth in 2025 driven primarily by licensing deals including U.S. rights licensed to Mayne Pharma. Despite this surge, the company continues to report net losses as heavy investment in research and clinical development persists. Sol-Gel maintains a strong liquidity position with ample cash and marketable securities but faces substantial doubt regarding its ability to sustain operations beyond one year without additional funding. Future growth hinges on successful commercialization, favorable trial outcomes, and securing further capital [F1], [S6], [S21].
Company Background and Business Model
Sol-Gel Technologies Ltd. is an Israeli-based pharmaceutical company focused exclusively on dermatology products. The company’s revenues derive primarily through licensing agreements, royalties, and collaborative research partnerships that often include cost-sharing of R&D expenses [S1], [S22]. Their current marketed portfolio includes key dermatology treatments EPSOLAY and TWYNEO, with recent strategic licensing agreements granting rights for sales in the United States to Mayne Pharma [S21].
As a development-stage company, Sol-Gel invests heavily in clinical trials and proprietary drug development programs aimed at addressing skin disorders.
Historical Financial Performance
Over the past four years, Sol-Gel experienced rapid revenue growth alongside continued net losses driven by clinical investments:
Historical performance (annual)
| FY | Rev ($mm) | Net ($mm) | CFO ($mm) | OpInc ($mm) | Rev YoY | Net YoY |
|---|---|---|---|---|---|---|
| 2025 | 19 | -6 | 0 | -8 | +68.0% | +42.1% |
| 2024 | 12 | -11 | -14 | -12 | +642.5% | +61.2% |
| 2023 | 2 | -27 | -18 | -29 | -60.0% | -82.5% |
| 2022 | 4 | -15 | -9 | -16 |
Source: SEC companyfacts cache [F1].
Capital returns and efficiency (annual)
| FY | FCF ($mm) | ROE% |
|---|---|---|
| 2025 | 0 | -26.9 |
| 2024 | -14 | -36.7 |
| 2023 | -18 | -70.5 |
| 2022 | -10 | -35.4 |
Source: SEC companyfacts cache [F1].
- Figures per fiscal year ended December; all figures sourced from latest SEC filings [F1].
Revenue more than quadrupled from under $4 million in 2022 to nearly $20 million in 2025 fueled by licensing arrangements including the Mayne Pharma deal contributing significantly to top-line growth [S21], [F1]. Net losses narrowed notably though remain due to sustained high R&D expenses.
Operating income improved by approximately 37% year-over-year between FY24 and FY25 but continues negative reflecting ongoing investment in clinical development. Operating cash flow turned positive by FY25 after several years of deep negative cash flow highlighting operational inflection aligned with milestone payments.
Capital expenditures remain modest relative to operating costs consistent with industry norms where spending focuses on clinical trials rather than fixed assets.
Revenue Composition and Geographic Distribution
Sol-Gel's revenues comprise royalties from product sales/licensing plus fees from intellectual property transactions and collaborative arrangements [S22]. Key geographic insights include:
- The U.S. dominated revenue in FY25 with approximately $16.7 million recognized following the Mayne Pharma licensing agreement for EPSOLAY and TWYNEO products.
- Canada showed steady growth rising from around $681k in FY24 to $1.7 million in FY25.
- Switzerland's contribution slightly declined while China’s revenues fell sharply post-FY24 peak.
- Other regions contributed minor amounts overall [S9].
All of the company’s property assets are located in Israel; foreign exchange exposure is managed via derivative instruments hedging USD/NIS currency risk [S13], [S26].
Research & Development Investment
R&D expenses remain a significant component of operating costs at over $22 million in FY25 despite increasing revenues [F1], [S15]. This reflects ongoing commitments including:
- Clinical trials involving external CROs,
- Preclinical studies,
- Scientific personnel payroll,
- Regulatory activities targeting new product approvals.
Clinical trial costs are accrued based on progress reports from CROs ensuring appropriate expense matching critical for accurate financial reporting [S1]. This level of R&D spend aligns with typical timelines for dermatology drug development requiring multiple years before commercial returns materialize.
Cash Flow and Liquidity Positioning
Operating cash flow improved markedly moving into positive territory by FY25 after several years of large outflows due to receipt of milestone payments tied to licensing deals [F1].
Liquidity remains solid with cash and equivalents totaling roughly $11 million at year-end FY25 alongside short-term marketable securities resulting in current assets near $27 million against current liabilities around $6.17 million yielding a strong current ratio exceeding four times coverage [F1], [S3].
However, management discloses "substantial doubt" regarding the company’s ability to continue as a going concern beyond one year without additional financing or collaboration agreements due to accumulated deficits exceeding $237 million highlighting ongoing capital raising needs typical for pre-commercial biotech firms [S6].
Capital Structure and Allocation Strategy
Equity capital comprises under three million shares outstanding supported by paid-in capital reflecting funds raised through public offerings and private placements led by controlling shareholders such as M. Arkin Dermatology Ltd. Recent equity raises include approximately $11.5 million net proceeds from registered direct offerings combined with about $10 million from private placements during early 2023 [S19], [S21].
No dividends or share repurchases have been declared consistent with reinvestment focus typical for early-stage biopharmaceutical companies prioritizing pipeline advancement over shareholder distributions [F1].
The company also operates share incentive plans primarily granting options to executive officers aligning management incentives with long-term value creation despite current accounting losses reported under GAAP [S19].
Industry Context and Risks
Operating within specialty dermatology pharmaceuticals places Sol-Gel amid a competitive biopharma niche where success depends heavily on multi-phase clinical trial validation followed by regulatory approvals that often require substantial time and capital investment before achieving scale revenues.
Currency risks arise due to most expenditures denominated in NIS while revenues increasingly come from USD markets; derivatives partially mitigate these exposures but residual risk persists operationally [S26].
Cybersecurity is also highlighted as an area of focus given sensitive intellectual property handled amid increasing threats targeting biotech firms globally [S1].
Forward-Looking Considerations
Key upcoming milestones include:
- Progression through late-stage clinical trials validating safety and efficacy,
- Regulatory submissions or approvals expanding commercial reach,
- New licensing or collaboration agreements generating upfront or milestone payments,
- Successful execution of capital raises necessary to extend operational runway,
- Market adoption dynamics post-commercial launches particularly leveraging Mayne Pharma partnership.
Monitoring quarterly updates on trial progress or funding status will provide important signals on operational trajectory.
Summary Table: Annual Financial Performance (USD Thousands)
| FY | Revenue | Operating Income | Net Income | Operating Cash Flow | Capex |
|---|---|---|---|---|---|
| 2022 | 3,883 | -16,244 | -14,923 | -9,484 | 171 |
| 2023 | 1,554 | -29,305 | -27,238 | -17,730 | 134 |
| 2024 | 11,538 | -12,014 | -10,580 | -13,889 | 2 |
| 2025* | 19,388 | -7,538 | -6,127 | 322 | 47 |
| *Figures per fiscal year ended December; compiled from SEC filings and Companyfacts snapshot.[F1] |
Conclusion
Sol-Gel Technologies Ltd exemplifies a growing dermatology pharmaceutical enterprise successfully expanding revenues through strategic licensing deals while sustaining aggressive investment into pipeline development underpinning medium-term value creation potential. Despite significant net losses persisting alongside heavy clinical expenditures warranting close attention to financing strategies critical for addressing going-concern uncertainties flagged by management. The company's focused single-segment business model centered on niche dermatological therapies positions it uniquely but exposes it substantially to clinical trial outcomes and regulatory timelines as primary determinants shaping future sustainability.
This report is prepared solely based on information provided through company filings as cataloged above ([F1], [S#]) without extrapolation or forecast modeling beyond explicit data points presented. It does not constitute investment advice or recommendations.
Disclaimer: This is research-only, informational analysis and not investment advice. It may include AI-generated interpretation and general industry context. Always verify important details using primary sources.
Comments