
ONE Group Hospitality’s Journey Through Expansion and Profitability Hurdles
A detailed exploration of how ONE Group Hospitality manages rapid revenue growth through capital-light franchising despite mounting net losses and liquidity pressures.
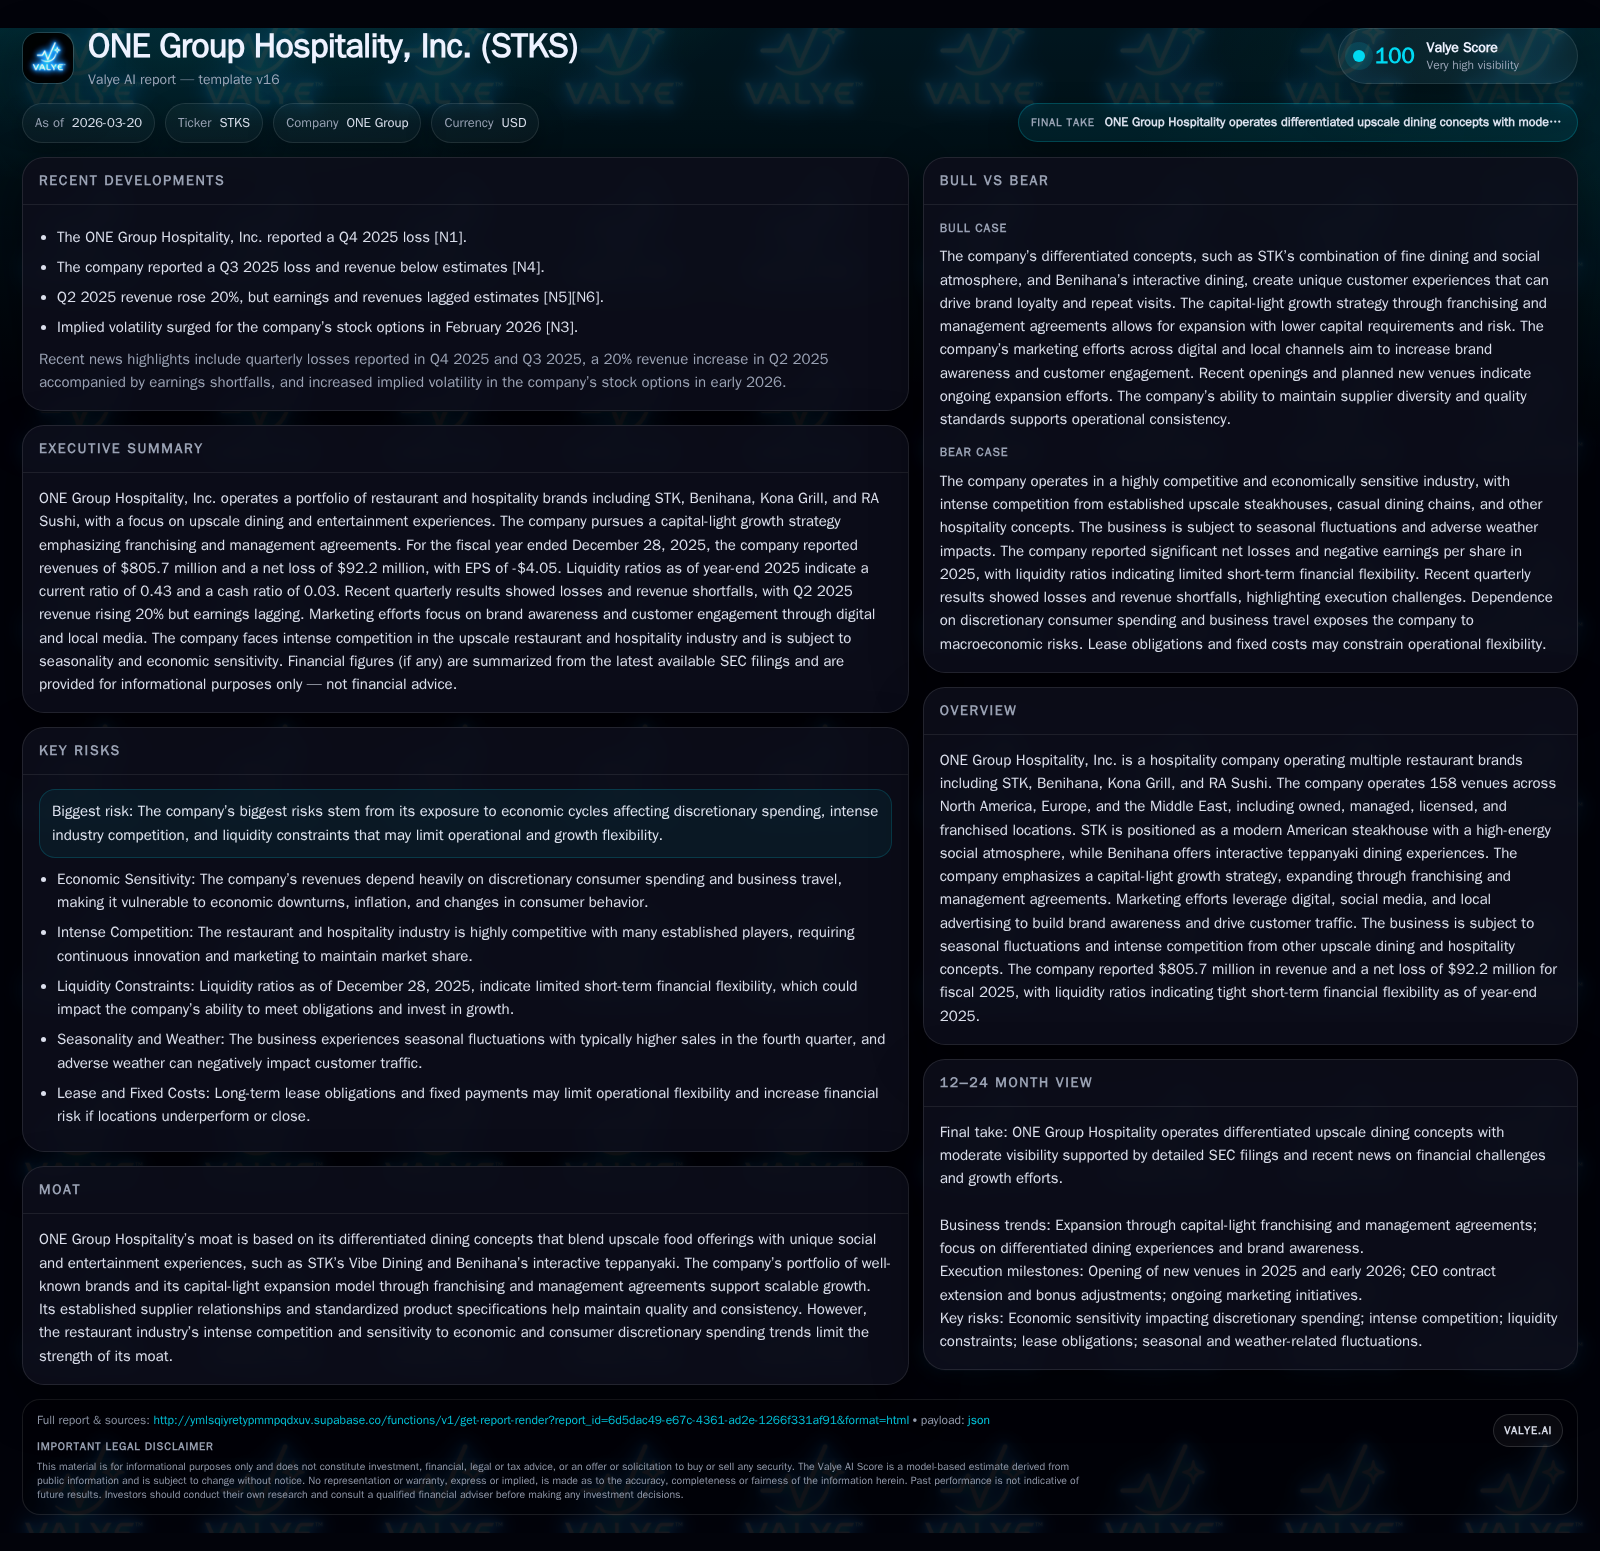
ONE Group Hospitality operates a portfolio of upscale dining concepts characterized by unique social atmospheres and interactive experiences. From FY2022 to FY2025, the company nearly doubled revenues while maintaining positive operating income until FY2025, when net losses surged due to non-operating costs. Their capital-light growth model, centered on franchising and management agreements, has accelerated geographic expansion but also contributed to cash flow challenges and strained liquidity. Competitive pressures, economic cyclicality, and shifting consumer preferences remain significant hurdles as the company advances its brand footprint internationally.
From Modest Beginnings to Revenue Surge: The Historical Growth Trajectory
Between FY2022 and FY2025, ONE Group Hospitality executed an aggressive expansion strategy that translated into nearly a two-and-a-half-fold increase in revenue — from approximately $317 million to over $805 million [F1]. This surge was underpinned by broadening their footprint of 158 venues encompassing STK, Benihana, Kona Grill, RA Sushi, and other hospitality services across North America, Europe, and the Middle East [S7]. Notably, the December 2025 signing of a landmark capital-light development agreement secured rights to open ten new Benihana or Benihana Express restaurants in the San Francisco Bay Area [S7], illustrating targeted regional growth.
The company’s ability to drive top-line growth hinges largely on leveraging its capital-light franchising and management agreements that reduce upfront capital deployment. For instance, STK’s average domestic owned/managed restaurant in 2025 generated around $14.2 million in revenue with an average check size pushing $129 per person — metrics signaling strong unit-level performance within premium urban locations averaging roughly 10,400 sq ft [S6][S7]. Similarly, Benihana reported owned restaurant averages of $6.3 million revenue with transactions averaging $116 each [S15]. This blend of upscale dining appeal combined with interactive/social environments—such as STK's signature "Vibe Dining"—have been fundamental drivers behind customer engagement and repeat patronage.
Historical performance (annual)
| FY | Rev ($mm) | Net ($mm) | CFO ($mm) | OpInc ($mm) | Rev YoY | Net YoY |
|---|---|---|---|---|---|---|
| 2025 | 806 | -92 | 30 | 8 | +19.7% | -482.9% |
| 2024 | 673 | -16 | 44 | 11 | +102.3% | -435.4% |
| 2023 | 333 | 5 | 31 | 9 | +5.1% | -65.1% |
| 2022 | 317 | 14 | 25 | 16 |
Source: SEC companyfacts cache [F1].
Capital returns and efficiency (annual)
| FY | Buybacks ($mm) | FCF ($mm) | ROE% |
|---|---|---|---|
| 2025 | 1 | -27 | 121.6 |
| 2024 | 3 | -27 | -33.6 |
| 2023 | 8 | -23 | 6.8 |
| 2022 | 7 | -7 | 19.4 |
Source: SEC companyfacts cache [F1].
Table: ONE Group Hospitality Annual Financial Performance Summary (FY2022–FY2025)
Dissecting Profitability: Operating Income Versus Net Loss Dynamics
Despite soaring revenues through aggressive scaling efforts, ONE Group’s operating income softened in FY2025 to around $8 million from $10.8 million in FY2024 — a roughly one-quarter decline highlighting margin pressures from expansion-related costs amid inflation [F1]. Strikingly though, net losses ballooned dramatically reaching a deficit of $92 million compared to a loss near $16 million the previous year [F1], signaling substantial drag from non-operating items including impairment charges or financing expenses disclosed in filings [N2][S1].
This dissociation suggests operating profitability is somewhat insulated by ongoing venue-level performance but is overwhelmed by corporate-level overheads, interest expense on debt facilities [S4], possible asset impairments related to re-positioning venues or lease terminations, or other extraordinary costs impacting the bottom line.
Capital-Light Strategy in Practice: Franchising and Management Agreements
ONE Group brands its approach as a "capital-light strategy" leveraging franchising, licensing, and management agreements that enable network expansion without commensurate capital outlay for property ownership [S7]. This method allows the company to scale its footprint significantly — with over half of venues either franchised or managed — reducing balance sheet risk while generating recurring royalty or management fees tied to venue sales.
For example, the company operates five licensed STK locations alongside five managed sites globally [S7], complemented by twelve franchised Benihana units contributing additional revenue streams distinct from directly owned venues.
Marketing efforts crucially support this model; targeted digital campaigns combined with local promotions are employed to build brand recognition pre-opening as well as sustain customer traffic post-launch [S6]. However, asset-light expansion carries challenges common in hospitality franchising such as ensuring operational compliance to protect brand integrity amidst decentralized control frameworks.
Geographic Spread and Brand Differentiation Driving Expansion
The geographical breadth spans three continents with a concentration in metropolitan markets exhibiting favorable demographics for luxury casual dining [S7][S25]. Concepts like STK fuse an American steakhouse offering with immersive nightlife ‘‘Vibe Dining,’’ featuring DJs and open bar spaces aimed at creating social magnetism uncommon among traditional steakhouses [S7]. Units average around 10k sq ft strategically located near high-end commercial districts.
Benihana preserves its teppanyaki heritage emphasizing chef-interactive tables that draw diners seeking entertainment alongside cuisine [S25]. Average unit sizes run slightly smaller than STK but anchor similarly affluent urban zones including Miami for franchised expansions under recent agreements.
Grill concepts such as Kona Grill supplement portfolio diversity targeting polished casual consumers with smaller units (~6,400 sq ft) delivering multi-cuisine menus tuned for approachable luxury dining at lower price points ($64 average checks) compared with flagship brands [S15][S26].
This distinct segmentation across tiers within upscale dining delivers diversification benefits though also necessitates managing brand-tailored marketing execution and supply chain intricacies fitting each format.
Cash Flows, Capex, and Liquidity: The Funding Puzzle
Operating cash flow retreated sharply by about one-third year-over-year in FY2025 whereas capital expenditure was curtailed by almost twenty percent compared to FY2024 levels [F1], resulting in negative free cash flow approximating $27 million—the first sustained negative FCF period since prior reporting years [F1]. This trend indicates significant working capital strain or timing mismatches around payables/receivables despite robust sales volumes.
Concurrently liquidity metrics appeared stressed; with current assets at roughly $57 million vs current liabilities exceeding $133 million at year-end resulting in a sub-0.5 current ratio—a liquidity red flag underscoring short-term funding tightness [F1][S4]. Debt covenants tied to their senior secured term loans may impose constraints on operational flexibility or refinancing options if cash inj flows remain subdued.
Mitigating these pressures entails vigilant covenant compliance monitoring plus improving cash conversion cycles alongside cautiously paced expansion investments.
Financial Health Metrics: ROE, Buybacks, and Shareholder Returns
Negative shareholders' equity reached near -$76 million in FY2025 reversing prior positive equity positions from earlier years due primarily to accumulated net losses undermining retained earnings buffers [F1]. This scenario renders traditional return on equity calculations meaningless without substantial adjustments.
Buyback activity tapered sharply reflecting pragmatic capital preservation amid adverse earnings dynamics—retiring less than $1.1 million during the latest fiscal period versus more robust repurchases historically [F1]. Dividend capacity remains constrained given low cash reserves ($4.2 million) against sizeable short-term obligations implying minimal leeway for distributions absent turnaround progress.
Overall capital allocation signals prioritization of liquidity conservation and reinvestment over shareholder returns until profitability stabilizes.[F1]
Competitive Pressures and Economic Sensitivities Shaping Risks
Industry headwinds include fierce competition from established upscale steakhouse chains like Ruth's Chris Steak House plus lifestyle-focused dining brands offering vibrant social atmospheres such as Nobu or Tao—forcing constant innovation within menu offerings and experiential features to retain relevance [S19]. Economic cycles heavily influence consumer discretionary spending with downturns expected to curb patronage at upscale venues causing volatile weekday casino/hotel-based foodservice revenues tied closely to business travel trends which have not fully normalized post-pandemic [S8][S26].
Emerging risks encompass shifts away from beef consumption driven by health or sustainability concerns limiting key menu components' appeal as well as impacts from labor cost inflation affecting margins further [S14][S26]. Social media-fueled reputational risks exacerbate vulnerability given instantaneous feedback loops regarding perceived service or food quality lapses creating potential visitation declines if unaddressed swiftly [S13].
What to Watch Next: Milestones and Market Sentiment Signals
Upcoming milestones worthy of scrutiny encompass execution progress on the San Francisco Bay Area development deal announced December 2025 setting expectations for multiple new openings accelerating West Coast presence [S7][N2]. Monitoring margin trends will clarify whether operational leverage can offset expansion-related cost burdens going forward potentially freeing up cash flow for deleveraging efforts.
Investor sentiment could reflect heightened implied volatility evidenced recently by stock option activity spikes suggesting anticipation around event catalysts including presentations at forums such as Sidoti’s Small-Cap Virtual Investor Conference held March 19th, accessible via their IR portal [N3][S3]. Absence of explicit forward guidance necessitates cautious interpretation yet key indicators remain growth pace moderation coupled with improved profitability targets along with maintaining covenant compliance on existing credit facilities.[N2]
Disclaimer: This analysis is intended solely for informational purposes based on available public documents as of March 20, 2026; it does not constitute investment advice or recommendations.
Disclaimer: This is research-only, informational analysis and not investment advice. It may include AI-generated interpretation and general industry context. Always verify important details using primary sources.

Comments