
Terra Property Trust’s Strategic Bet on Middle Market Real Estate Credit
Terra Property Trust leverages its niche in $10–$50 million commercial real estate loans to generate income amidst refinancing and revenue pressures.
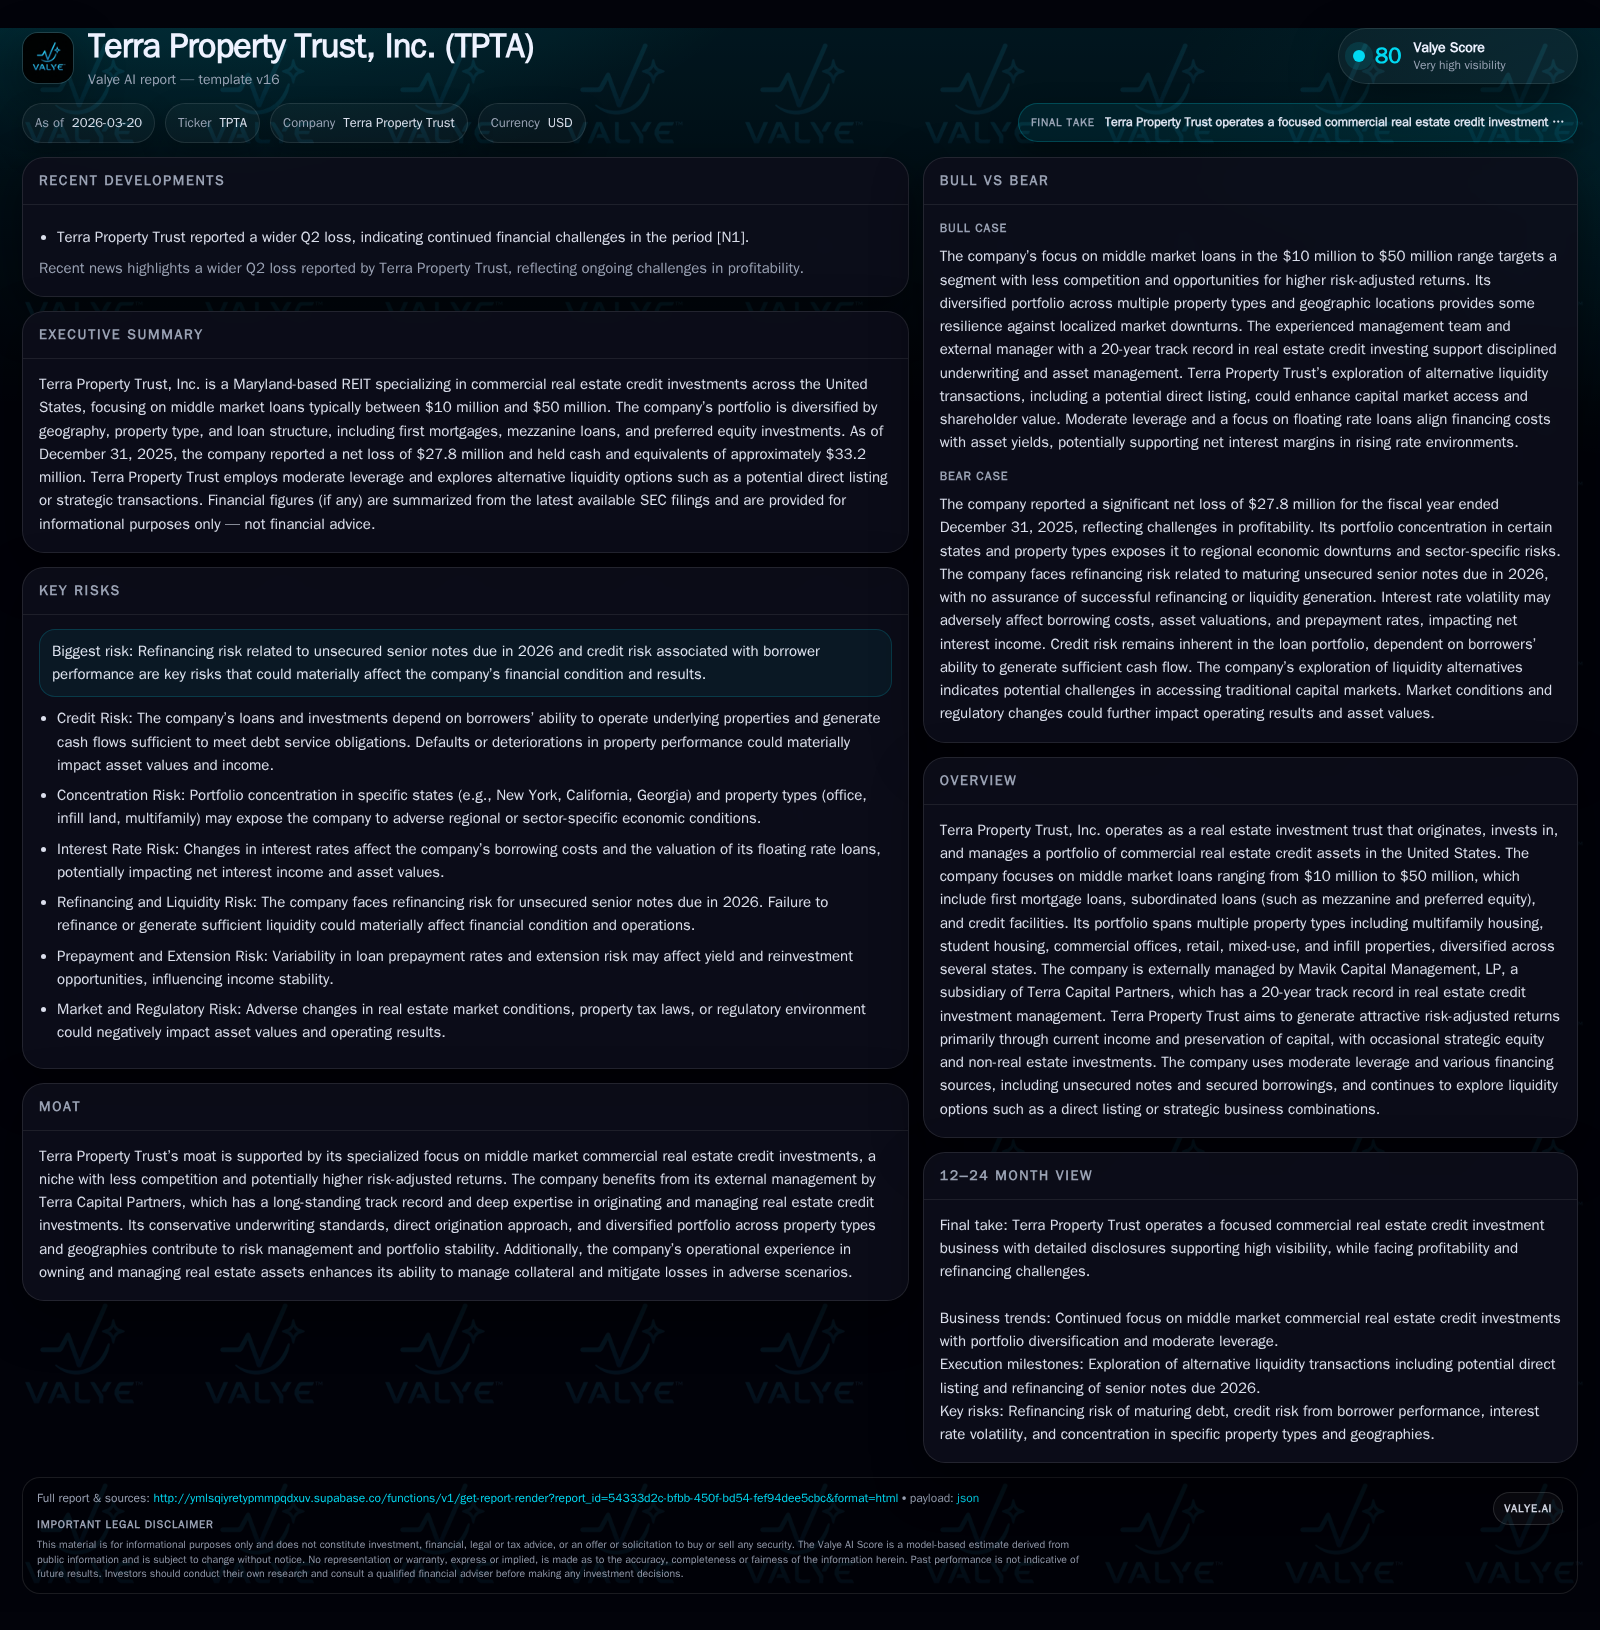
Terra Property Trust, Inc. has experienced a notable decline in revenue over 2023–2025, accompanied by persistent but narrowing net losses. The firm’s strategic focus on the underpenetrated middle market commercial real estate credit segment—spanning first mortgages, mezzanine debt, and preferred equity across diversified property types—supports an attractive risk-adjusted return profile. However, significant refinancing risks loom with unsecured senior notes maturing in 2026, and liquidity management remains paramount. Capital allocation has emphasized steady dividends despite losses, supported by improving operating cash flow. Key to future performance will be managing loan portfolio credit quality and successfully addressing near-term debt maturities without compromising distributions or growth.
Historical Financial Trends: Revenue Decline and Income Volatility
Terra Property Trust’s financial trajectory over the past four fiscal years has exhibited considerable volatility reflective of macroeconomic pressures and portfolio dynamics. Revenues peaked in 2023 at approximately $67.9 million before declining substantially to $35.4 million in 2025 — a year-over-year contraction of roughly 28.7% [F1]. This decline parallels significant principal repayments within the loan portfolio reducing earning asset balances.
Operating income has mirrored this trend with losses deepening after a brief rebound in 2024. Specifically, Terra moved from a positive operating income of about $3.9 million in 2024 back into negative territory, reporting an operating loss of approximately $1.3 million for FY2025 [F1]. Net income follows a similar pattern: albeit still negative at $27.8 million loss in 2025, the deficit narrowed by about a quarter from the prior year’s nearly $37.2 million loss [F1]. This sharpening net loss percentage reduction signals disciplined expense management but underscores continued portfolio income compression.
Operating cash flow dynamics illustrate resilience; while negative CFO marked several preceding years including -$3.3 million in 2024, FY2025 achieved positive operating cash flows near $1.9 million — suggesting incremental stabilization at the cash earnings level [F1]. Despite these moves toward cash generation recuperation, sustained revenue contraction highlights broader headwinds for Terra’s credit investment approach.
Historical performance (annual)
| FY | Rev ($mm) | Net ($mm) | CFO ($mm) | OpInc ($mm) | Rev YoY | Net YoY |
|---|---|---|---|---|---|---|
| 2025 | 35 | -28 | 2 | -1 | -28.7% | +25.1% |
| 2024 | 50 | -37 | -3 | 4 | -26.8% | +34.7% |
| 2023 | 68 | -57 | 9 | -24 | +20.0% | |
| 2022 | 57 | 0 | 11 |
Source: SEC companyfacts cache [F1].
Capital returns and efficiency (annual)
| FY | Div ($mm) | ROE% |
|---|---|---|
| 2025 | 12 | -19.0 |
| 2024 | 19 | -20.0 |
| 2023 | 19 | -23.5 |
| 2022 | 16 |
Source: SEC companyfacts cache [F1].
Note: Operating income and net income YoY changes reflect substantial swings caused by mark-to-market adjustments and portfolio turnover.
The Middle Market Niche: Portfolio Composition and Underwriting Strengths
Central to Terra Property Trust’s strategy is its focus on middle-market commercial real estate credit investments targeting loans ranging from approximately $10 million up to $50 million [S1,S2]. This niche is less crowded relative to more commoditized mega-loans exceeding $100 million prevalent among larger REIT lenders or CMBS conduits.
The company’s portfolio embraces multiple loan structures including first mortgage loans—which finance acquisition or development phases—as well as subordinated debt such as mezzanine loans and preferred equity interests that typically carry higher yields commensurate with increased risk [S21,S25]. This tranche stratification enables Terra to tailor risk-return profiles aligning with specific property and borrower characteristics.
Property type diversification is meaningful: as of end-2025 the underlying collateral spans multifamily housing (~20%), student housing segments alongside industrial properties primarily located across seven states including New York (largest concentration), California and Georgia [S23]. Notably heavy allocations to office and infill land properties (together representing over half the portfolio) transmit some cyclical vulnerability yet offer upside where localized demand persists.
A key value proposition resides within their conservative underwriting framework—benefiting from direct origination capabilities via Terra Capital Partners (external manager)—which applies rigorous financial analysis alongside structural diligence encompassing borrower covenants and collateral monitoring processes [S19,S21]. This reduces the likelihood of material losses while facilitating attractive current income generation prioritized through floating-rate instruments largely matching their floating-rate liabilities.
Refinancing Risks and Debt Maturity Profile into 2026
Terra Property Trust faces material refinancing challenges driven by sizable unsecured senior note maturities aggregating approximately $119 million due between March and June of calendar year 2026 [S4,S6]. This concentration necessitates effective liquidity management to avoid distressed asset sales or covenant defaults which would adversely impact operations.
Repayment strategies emphasize cash flows from scheduled principal receipts on performing loans combined with opportunistic asset dispositions where warranted alongside potentially accessing new financing facilities or raising capital through equity issuance by way of reinvestment plans or private placements managed by affiliated entities [S6,S18].
Participation agreements—which historically supplemented Terra's lending capacity without direct liability—have diminished notably from previous periods with only ~$18 million remaining outstanding as of end-2025; their planned maturities coincide closely with secured borrowings rollover schedules reducing incremental financing strain but emphasizing dependence on ordinary course loan repayment cycles for liquidity replenishment [S4,S6].
Widening yield spreads amid rising interest rate environments could constrict refinancing options further; thus timing new borrowings or managing loan prepayments will be critical.
Capital Structure Insights: Leveraging, Participation Agreements, and Liquidity
Terra currently employs moderate leverage blending unsecured notes payable totaling roughly $119 million alongside secured financings approximate to $62 million as foundational pillars of capital structure at December-end 2025 [F1,S4]. Interest rates range across fixed sources (notably a weighted average coupon ~6%) while variable components are indexed to Term SOFR plus premiums often exceeding high single digits due to floors ensuring minimum effective costs [S7].
Participation agreements—which serve as contingent co-investment tools reducing immediate capital outlay obligations—have been strategically curtailed as internal capital capacity expanded; outstanding obligations under these agreements decreased compared to antecedent periods enhancing flexibility for refinancing decisions without undue reliance on partners' funds [S25].
Liquidity remained stable with cash & equivalents positioned around $33 million at fiscal close reflecting prudent treasury management focused on safeguarding against maturities clustering within early- to mid-2026 horizon constrictions [F1]. The revolving line of credit matured mid-2025 was fully repaid shortly thereafter easing short-term rollover risks though limiting immediate borrowing fallback options absent replacement facilities [S6].
This mix illustrates careful tranche layering seeking consistency between floating-rate assets and liabilities mitigating exposure to rate-reset mismatches common in CRE lending frameworks.
Prospects for Growth: Income Stability Amid Market Conditions
Looking forward while explicit company guidance remains scarce there are pointers towards modest near-term loan funding equalizing around $9.4 million expected drawdowns against unfunded commitments within the subsequent twelve months implying incremental but constrained growth potential consistent with portfolio amortization pacing [S5,S6].
Income stability is intertwined with borrower repayment performance; Terra’s emphasis on middle market transactions limits competitive pressures yet exposes it to idiosyncratic credit cycles tied closely to regional economic conditions notably in New York and California where nearly two-thirds of net loans reside [S23].
Additionally absent public market liquidity—the shares remain unlisted—the firm must carefully weigh capital raising options when addressing scheduled note maturities making careful monitoring of weighted-average maturity extensions alongside new originations pipelines essential indicators moving forward.
Capital Allocation: Dividends, Cash Flow, and Return on Equity
Despite net losses ongoing dividend distributions have remained relatively consistent reflecting REIT tax distribution mandates requiring at least 90% payout of taxable income including certain non-cash components limiting internal capital accumulation capabilities [F1,S24]. Total dividends paid amounted to approximately $11.6 million for FY2025 down from roughly $18.6 million the previous year indicating cautious distribution scaling aligned with cash flow realities.
Improved operating cash flow nearing two million USD suggests better alignment between reported earnings pressures and actual liquidity generation supportive of current dividend levels although sustainability depends heavily on loan interest collections remaining intact versus principal amortization speed [F1].
Return on equity currently stands negative near -19%, reflective mainly of accounting losses offset somewhat by stabilized book equity position approximating $146 million down from over $185 million one year prior consistent with asset run-off strategy post peak investment deployments [F1]. No share buybacks were noted recently underscoring prioritization of balance sheet preservation over capital returns enhancing flexibility amidst refinancing risks.
Key Metrics to Watch: Earnings Trajectory and Liquidity Milestones
Investors following Terra should keenly observe upcoming quarterly filings for trends both in net income improvements post-2025 fiscal year-end as well as any shifts in operating cash flow indicative of either tightening credit controls or emerging non-performing loans within the middle market loan pool.
Other critical markers include progress made against maturing unsecured senior notes due throughout Q1/Q2-2026—whether via successful refinancing arrangements or accelerated amortizations—and updates regarding available liquidity buffer expansions through new capital raises or debt facility term extensions impacting potential operational continuity.
Further disclosure around weighted average maturity extensions or originations volume increases would signal endurance in growth prospects beyond purely managing legacy assets under runoff conditions.
Risk Factors: Borrower Performance and Market Challenges
The foremost risks confronting Terra Property Trust embed deeply within borrower credit performance under fluctuating economic regimes especially given geographic concentrations heavily weighted towards select states vulnerable to regional downturns or legislative shifts affecting commercial real estate valuations notably California’s Proposition 13 debates influencing property tax burdens indirectly affecting borrower debt service capacity [S1,S23].
Refinancing risk remains acute given concentration in unsecured notes due imminently coupled with macroeconomic tightening increasing funding costs relative to asset yields diminishing margin buffers crucial for profitability preservation ([S18]).
Interest rate volatility poses dual challenges—upward movements raise capital costs just as they reduce relative attractiveness versus competing fixed income products potentially pressuring stockholder distribution expectations noted absence of public trading liquidity hinders price discovery mechanisms impacting investor sentiment.[S1]
Regulatory uncertainties concerning REIT status qualifications or tax treatments also pose latent risks that may affect long-run compliance costs or operational parameters altering return landscapes fundamentally.
This analysis synthesizes available SEC filings and financial data as of March 20th, 2026 without providing investment advice or recommendations.
Disclaimer: This is research-only, informational analysis and not investment advice. It may include AI-generated interpretation and general industry context. Always verify important details using primary sources.

Comments