
VANJIA CORP’s Financial Resilience Despite Transparency Challenges
Despite prolonged opacity around its business operations and a lack of revenue growth, VANJIA CORP maintains solid liquidity and capital structure, presenting a paradoxical financial profile.
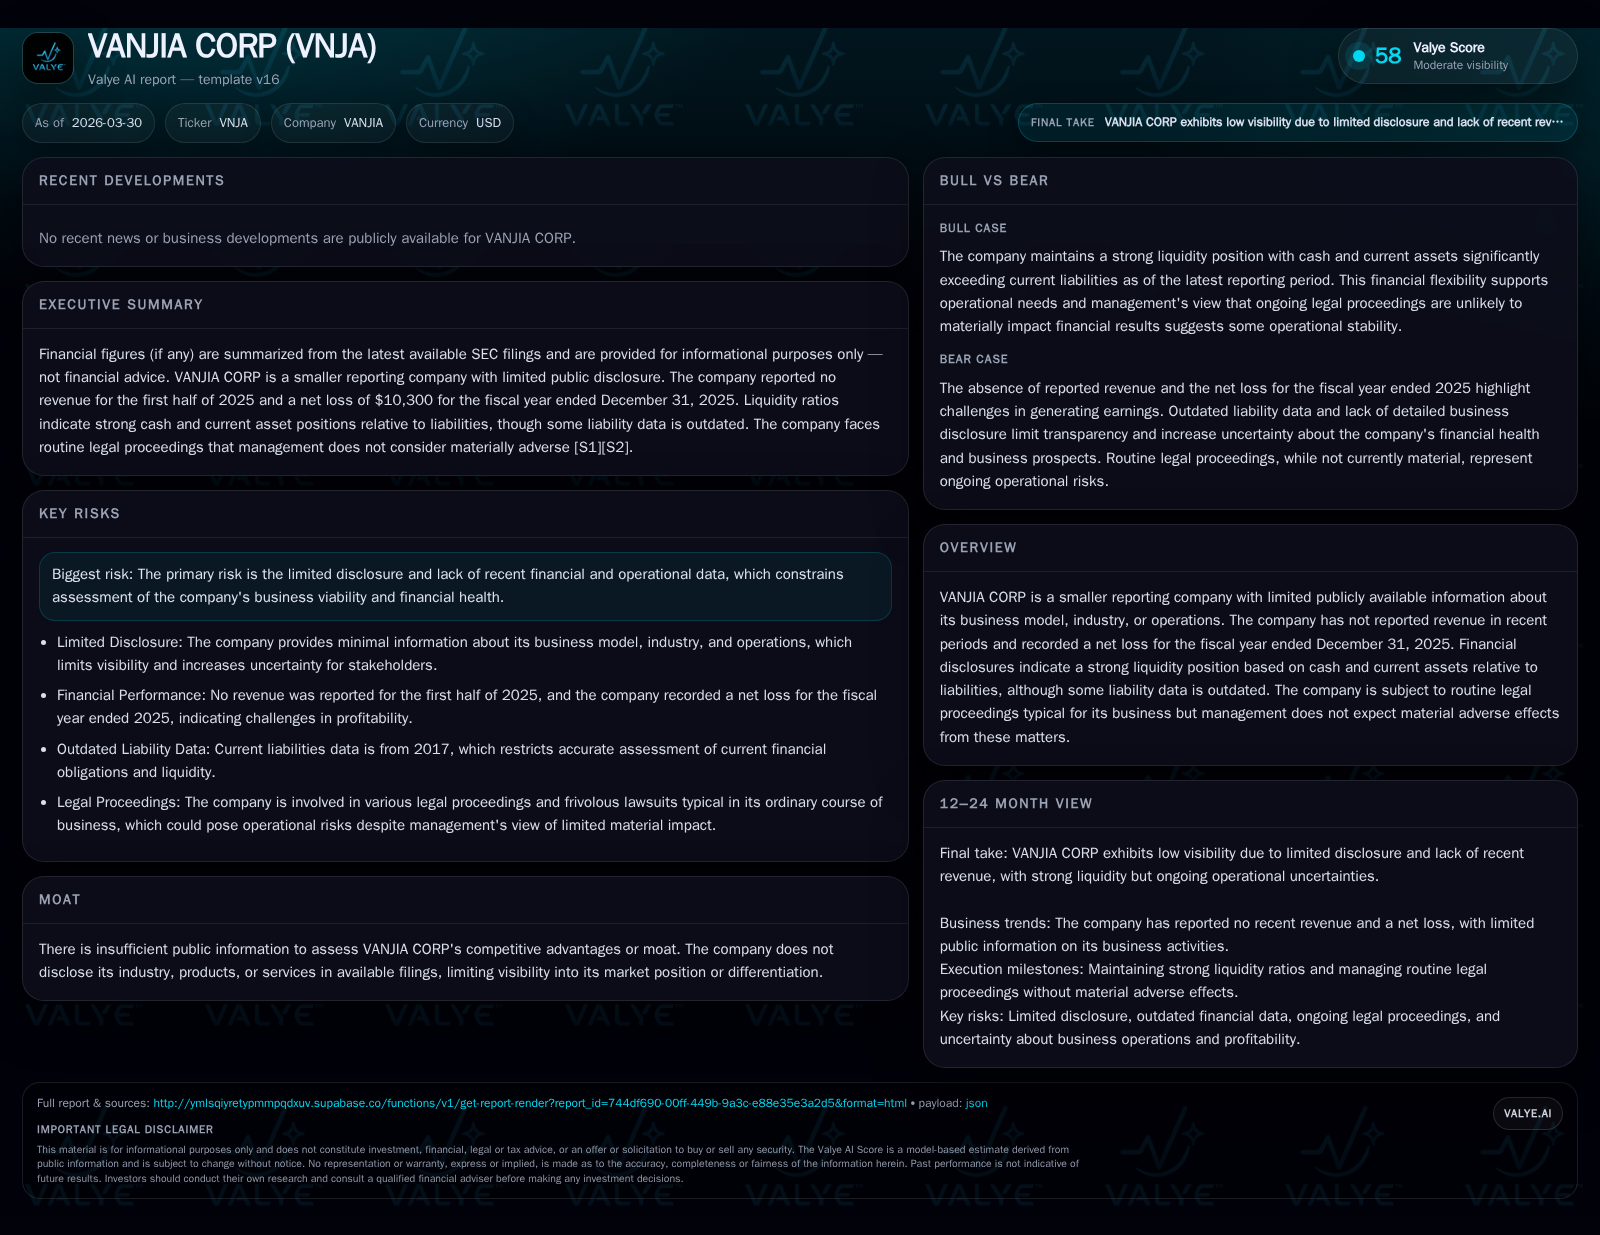
VANJIA CORP exhibits a striking contrast between strong balance sheet metrics and limited operational disclosure. Over recent years, the company has seen flat revenues alongside a shift from profitability to sustained net losses. Its liquidity position remains robust, thanks to a high current ratio driven by cash reserves, although some liability data is notably outdated. The absence of transparency on business segments and future guidance restricts assessment of its growth trajectory and risk profile.
Historical Financial Trajectory: Growth Patterns and Profit Volatility
VANJIA CORP's revenue profile over the past four fiscal years reveals an initial increase followed by flattening at roughly $82.7K for fiscal years 2023 and 2024 [F1]. This stagnation masks deeper volatility within profitability metrics. The fiscal year 2023 marked a peak operational performance with an operating income of $73.4K; however, this figure reversed sharply into negative territory the following two years, with operating losses of -$13.9K in FY2024 and -$10.3K in FY2025 [F1]. Correspondingly, net income tracked this trend closely — profitable in FY2023 before declining to losses matching operating income magnitude through FY2025.
Year-over-year percentage changes highlight this erosion: operating income declined approximately 26.1% from FY2024 to FY2025 mirroring net income trends. These swings suggest either rising operational costs outpacing flat revenue or possibly one-time adjustments not apparent due to limited disclosures.
Historical performance (annual)
| FY | Rev ($) | Net ($) | CFO ($) | OpInc ($) | Rev YoY | Net YoY |
|---|---|---|---|---|---|---|
| 2025 | -10300 | -10300 | -10300 | +26.1% | ||
| 2024 | 82720 | -13943 | 50321 | -13943 | 0.0% | -119.0% |
| 2023 | 82720 | 73419 | 4434 | 73419 | +142.2% | +743.3% |
| 2022 | 34160 | -11412 | -11412 | -11412 | 0.0% |
Source: SEC companyfacts cache [F1].
Capital returns and efficiency (annual)
| FY | ROE% |
|---|---|
| 2025 | -15.3 |
| 2024 | -18.0 |
| 2023 | 8.8 |
| 2022 | -1.5 |
Source: SEC companyfacts cache [F1].
Fiscal year designations correspond to reporting periods ending December 31 per [F1].
The Elusive Business Model: Impact of Non-Disclosure on Valuation and Risk
VANJIA CORP is classified as a smaller reporting company under SEC Rule 12b-2 and repeatedly notes in its filings that it is exempt from providing extensive disclosures typically required of larger entities [S1][S2][S3][S7][S9]. This regulatory status correlates with significant opacity surrounding its core business operations — no clear industry classification, product lines, geographic markets or customer segments are publicly described [S4].
Such omission complicates any valuation or risk assessment since there is no visibility into the company's competitive positioning or potential economic moat. Lacking segmentation data or strategy narratives limits external stakeholders' ability to ascertain whether VANJIA operates within volatile sectors or stable niches.
Moreover, the absence of detailed operational commentary restricts identification of growth drivers or cost structures impacting recent profit swings. This information vacuum represents the primary risk factor underscored repeatedly across multiple risk factor disclosures [S1][S3][S7][S9], emphasizing that external analysis must remain cautious due to unknown fundamental factors.
Liquidity and Capital Strength: Unpacking VANJIA’s Cash Position and Current Assets
Liquidity measures stand out as VANJIA’s most demonstrable financial strength amid other uncertainties. At the close of fiscal year-end December 31, 2025, cash and equivalents totaled approximately $62.6K supported by total current assets near $77.2K as of Q1–25 [F1][S6]. This compares against reported current liabilities of roughly $8.8K — however critical context is that the latest liabilities figure available dates back to December 2017 [F1].
Given this discrepancy and the lack of updated liability disclosures in more recent filings [S5], reliability regarding exact leverage ratios or solvency assessments must be tempered with caution.
Assuming static liabilities since 2017—a conservative assumption given normal business conditions—the resulting current ratio approaches an impressive ~8.77x [F1], substantially above standard thresholds indicating strong short-term solvency buffers.
This liquidity cushion likely mitigates immediate default risks even though operational losses erode equity bases elsewhere. It may also provide management flexibility during periods without clear revenue growth or external funding events.
Operational Performance and Loss Trends: Scrutinizing Operating Income and Net Results
An examination of VANJIA's operating results over recent years shows a narrative reversal that demands scrutiny despite steady revenues around $82.7K from fiscal years 2023 onward [F1]. After achieving a sizable positive operating income in FY2023 (approximately $73.4K), subsequent years have seen persistent operating losses (-$13.9K in FY24; -$10.3K in FY25). This deterioration likely reflects increasing expenses or possibly changes in cost structure unaligned with revenue stability.
Net income closely mirrors this adverse trend suggesting no meaningful non-operating items offsetting core negative earnings power.
These sustained operating deficits underscore vulnerability concerning profitability sustainability absent either new revenue streams or stricter cost controls going forward.
Legal Environment and Risk Factors: Typical Litigation without Material Impact
VANJIA’s SEC reports reference ongoing involvement in various legal proceedings consistent with typical small enterprise operational environments [S1][S3][S9]. Such matters are described as "routine" or "frivolous lawsuits" arising within ordinary course commercial activity.
Management explicitly indicates no expectation that these legal actions will result in materially adverse outcomes for financial results or the company’s overall condition—this caveat tempers alarm about contingent liabilities.
Nonetheless, given limited transparency around case specifics or settlement accruals—keeping watch on future legal disclosures will remain prudent for stakeholders vigilant about potential emerging risks.
Forecast Indicators and Monitoring Points: What Investors Should Watch Next
The company has issued no public forecasts or guidance on future milestones nor elaborated on business development plans [N/A]. This silence compounds uncertainty inherent from scarce operational data.
From an analytical perspective, key performance indicators warranting close attention include:
- Quarterly updates clarifying liabilities figures which currently rely on outdated references (2017 data).
- Changes in disclosure levels that might illuminate segmental performance or strategic shifts.
- Ongoing monitoring of cash burn rates derived from cash flow statements beyond calendar year-end snapshots.
- Any announcements regarding business model evolution or new ventures giving indication toward sustainable growth opportunities.
Without such disclosures forthcoming soon enough from VANJIA’s corporate communications or mandated filings [N/A], projections remain speculative beyond surface-level balance sheet robustness.
Capital Allocation Dynamics: Equity Trends, ROE, Cash Flows, and Shareholder Returns
Historical equity has contracted significantly from approximately $833k at the end of fiscal year 2023 down to an estimated $67k by end-2025 [F1]. This steep decline distinctly signals cumulative operating losses impacting retained earnings plus potential asset impairments unreported explicitly but inferred through shrinking net worth figures.
Return on equity (ROE) calculated using latest annual net loss figures against closing equity approximates negative -15.3%, indicative of unprofitable capital usage in recent reporting cycles [F1].
Operating cash flow presents a volatile pattern with modest positive inflows during FY2023 ($4.4k) followed by stronger positive ops cash flow ($50k) in FY24 suddenly reversing into negative territory (-$10k) by FY25 [F1]. Such swings may reflect episodic timing shifts or erratic expense recognition impacting working capital components.
There are no recorded dividend pay-outs nor share repurchase programs mentioned in filings—a probable reflection of capital preservation priorities given delicate financial footing [N/A].
Overall capital allocation appears constrained by deteriorating earnings power yet partially supported by sufficiently liquid balance sheet positions as outlined earlier.
Disclaimer: This analysis synthesizes publicly available financial data and SEC filings without access to proprietary internal information about VANJIA CORP’s strategic initiatives or undisclosed operations. The lack of detailed business disclosures limits the scope for definitive conclusions regarding its market position or long-term prospects while highlighting areas warranting investor vigilance regarding transparency and evolving financial health.
Disclaimer: This is research-only, informational analysis and not investment advice. It may include AI-generated interpretation and general industry context. Always verify important details using primary sources.
Comments