
Advance Auto Parts Strengthens Margins and Streamlines Operations Following 2024 Restructuring
Recent quarterly results highlight margin improvements and operational efficiencies amid ongoing supply chain consolidation.
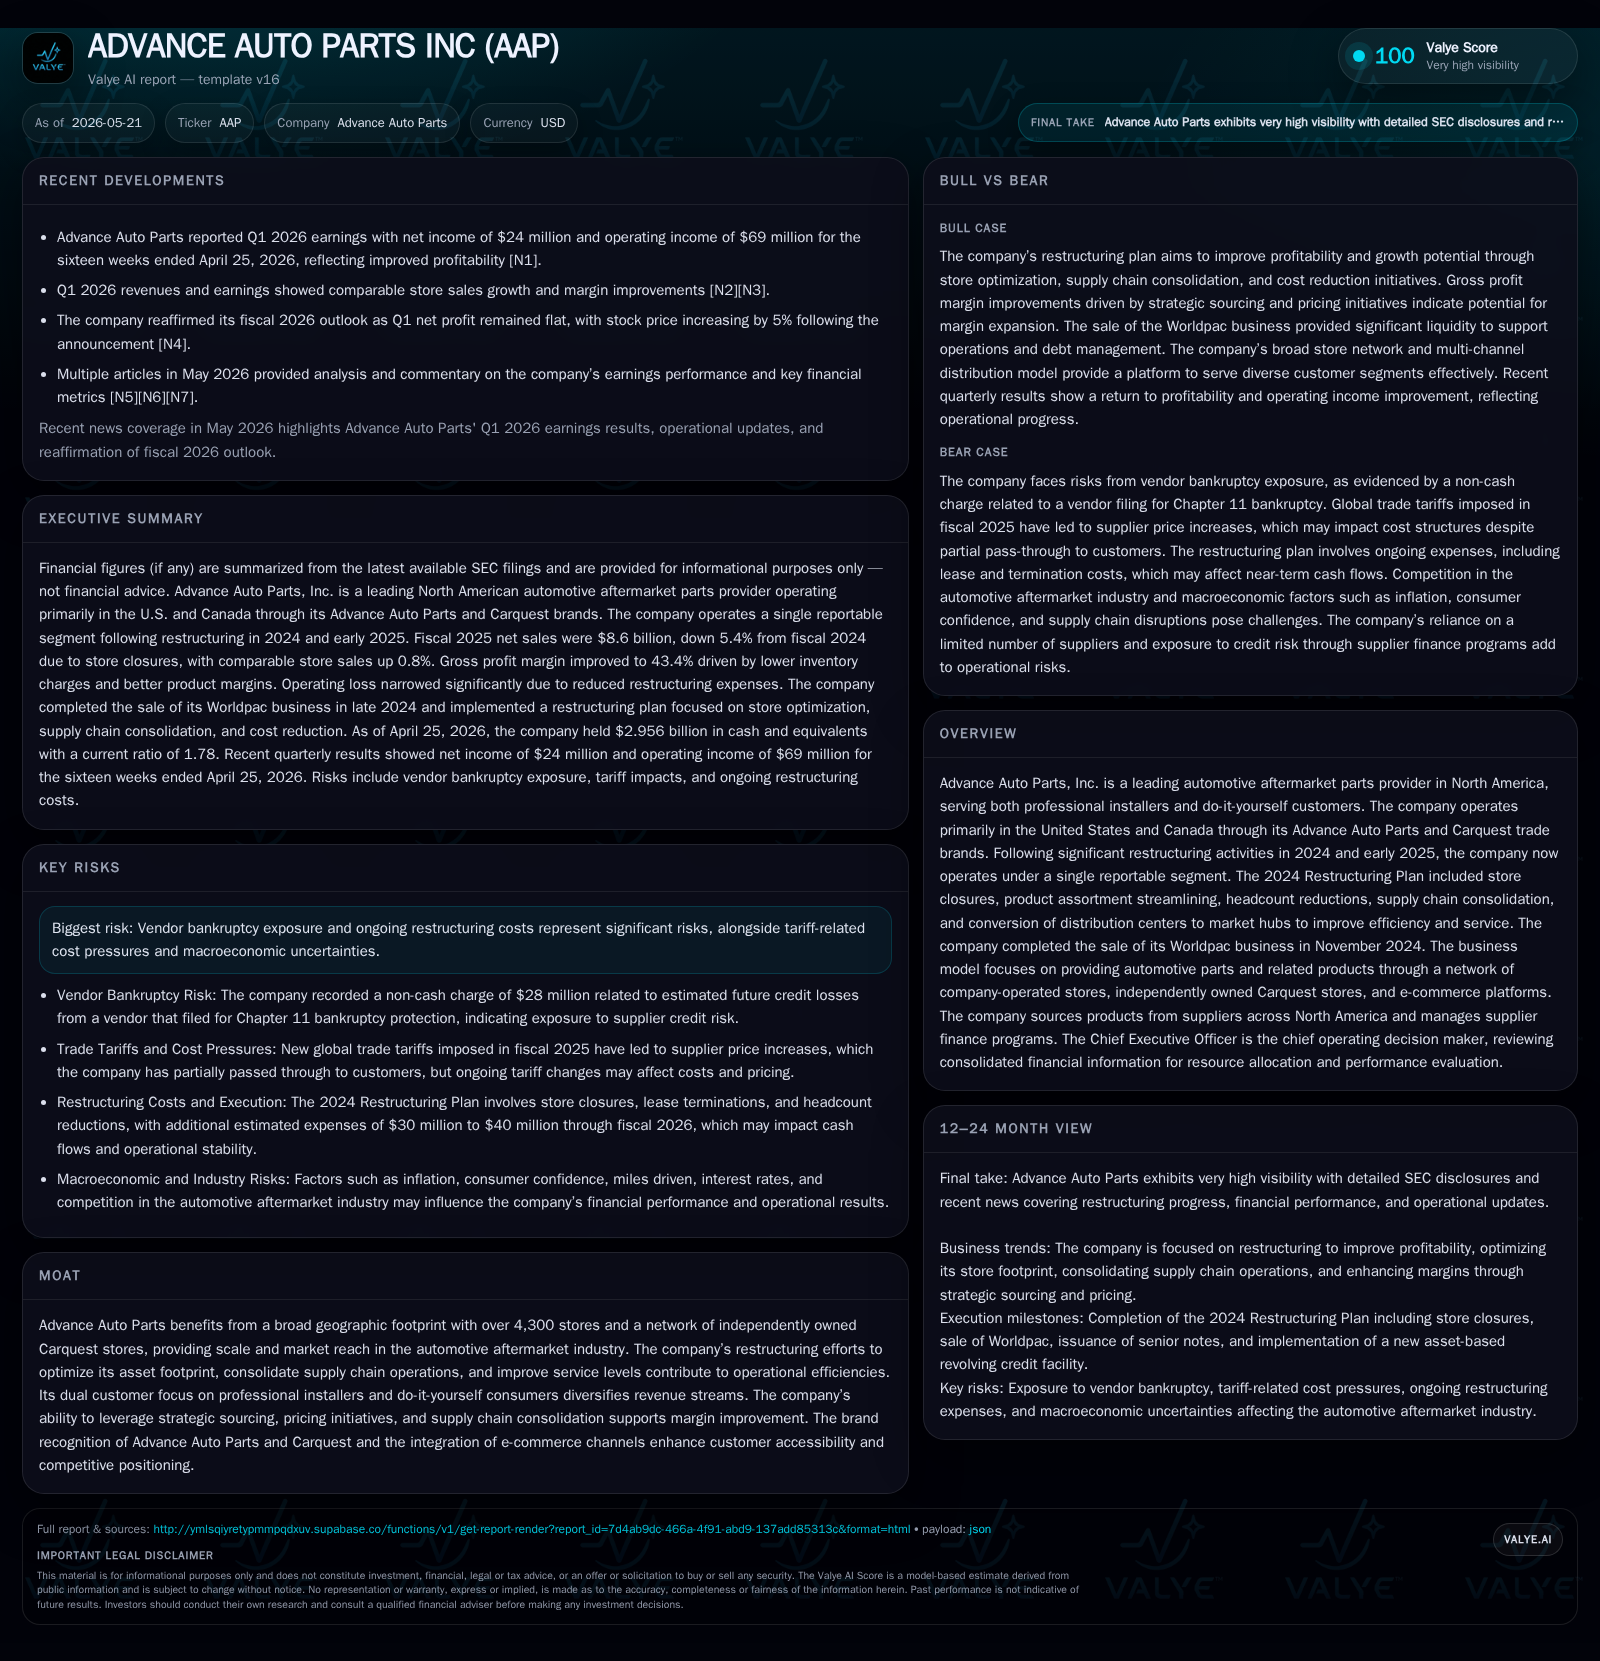
Advance Auto Parts reported a solid first quarter in 2026 marked by improved gross margins and reduced restructuring expenses following extensive strategic actions completed in 2024 and early 2025. The company continues to leverage its dual customer focus and broad geographic footprint as it consolidates distribution centers into market hubs, optimizing supply chain efficiency. While revenue growth remains modest due to store closures under the restructuring plan, margin expansion and cost control underpin improving operating income.
Recent Operating Update: Q1 2026 Results
Advance Auto Parts (AAP) released its latest quarterly results on May 21, 2026 ([S2], [S3]). The first quarter ended April 25 showed significant operational improvement compared to prior-year periods hampered by aggressive restructuring expenses. Net sales came in at approximately $2.61 billion, slightly exceeding the prior year's $2.58 billion but remaining impacted by store optimization initiatives that included closures under the comprehensive 2024 Restructuring Plan ([S2], [S20]).
Operating income for Q1 turned positive at $69 million versus an operating loss of $131 million the previous year — a swing predominantly aided by sharply reduced restructuring expenses ($32 million vs. $118 million last year) and improved gross margin performance of approximately 45.1% compared to last year's pressures ([S23]). This momentum indicates that the cost rationalization efforts, coupled with supply chain consolidation, are materializing into tangible financial benefits.
Cash and equivalents stood robust at roughly $2.96 billion at quarter-end with total debt around $3.45 billion, positioning net debt near half a billion dollars—a manageable leverage for the sector ([F1], [S2]). Demand remained stable across professional installer and do-it-yourself (DIY) segments despite macroeconomic uncertainties.
Business Model Overview
Advance Auto Parts operates primarily in North America's automotive aftermarket sector, catering distinctly to two customer segments: professional installers who rely on rapid service for repair shops and DIY consumers managing their own vehicle maintenance ([S1]). Revenue streams flow from sales of automotive replacement parts, accessories, batteries, tools, fluids, and car care products through company-owned stores, independently owned Carquest stores under franchise arrangements, and online platforms.
The business model is built on scale—with over 4,300 retail locations providing broad geographic coverage—and differentiated service tailored to professional customers demanding inventory availability alongside convenience shopping for DIY clients (). Revenue mechanics operate mainly on retail sales volumes influenced by vehicle age trends (older vehicles require more aftermarket maintenance), pricing premiums enabled by brand recognition and service quality, plus vendor rebates that reduce cost of goods sold ([S1], [S18]). Vendor funding mechanisms involving volume rebates help manage gross margins but introduce estimation risk if purchase volumes shift unexpectedly.
Following the major restructuring announced in late 2024, AAP has streamlined its product assortment to focus on high-turnover SKUs matched closely to customer preferences—reducing obsolete inventory risks highlighted historically ([S1]). The divestiture of Worldpac finalized in late 2024 allowed concentration on core North American retail operations without distraction or resource dilution (, [S13]).
Industry Structure and Competitive Position
The automotive aftermarket is fragmented but dominated by a few national players including Advance Auto Parts, O'Reilly Automotive, AutoZone, and NAPA Auto Parts (operated by Genuine Parts Co.). Scale matters given complex supply chains requiring rapid parts replenishment and broad SKU assortments. AAP's network scale enables bargaining power over suppliers combined with geographic proximity enhancing service levels.
Competitive differentiation lies partly in balancing professional installer requirements—who prioritize immediacy and technical support—with DIY customers seeking value pricing and e-commerce convenience (). Efficiency gains from converting distribution centers into multi-echelon market hubs reduce transportation costs while increasing system responsiveness—a critical factor given just-in-time expectations in this industry ([S20]).
However, competition also remains intense on pricing especially for commoditized parts categories; strategic sourcing and vendor incentives drive margin resilience but depend heavily on stable vendor relationships. Industry cyclicality is muted relative to new car sales since aftermarket demand correlates structurally with vehicle fleet size and average vehicle age—both secularly favorable trends due to rising vehicle longevity.
Growth Drivers
- Asset Optimization & Supply Chain Efficiency: The completion of store closures (~500 locations including independent Carquest), distribution center consolidations to market hubs improves inventory turns and reduces stock-outs while lowering cost-to-serve ([S20]).
- Ecommerce Expansion: Leveraging digital channels complements physical footprint enabling omnichannel customer experience; progress here supports reaching broader DIY audience
- Professional Customer Focus: Enhancing service offerings tailored for professional installers—including tailored inventories, loyalty programs, and technical training—strengthens recurring revenue as this segment tends to be less price sensitive.
- Product Assortment Rationalization: Continued streamlining enhances inventory quality reducing excess/obsolete stock risk while improving gross margin capture via better SKU mix ([S1]).
- Operational Excellence Initiatives: Investments in frontline personnel productivity through reinvestment of savings ensure better execution driving customer satisfaction.
- Macroeconomic & Fleet Trends: Increasing average vehicle age sustains aftermarket demand structurally independent of new vehicle sales volatility.
Risks and Watchpoints
- Vendor Bankruptcy Risk: The bankruptcy filing of a major auto parts supplier during fiscal 2025 exposed AAP to estimated credit losses impacting cost of goods sold ([S1]). Future supplier disruptions could threaten inventory availability or increase costs.
- Tariff Uncertainties: Previously imposed tariffs under IEEPA introduced product cost pressures; while some refunds may be recoverable post-Supreme Court overturning, timing and realization remain uncertain ([S9]).
- Restructuring Charges: Although significant restructuring related expenses have declined sharply (from $118 million in Q1 last year to $32 million currently), residual costs including accelerated depreciation or asset impairments for exited stores or leases could arise intermittently ([S12], [S18]).
- Competitive Pricing Pressure: Commodity-like automotive parts face persistent pricing competition; failure to maintain supplier incentives or cost discipline could erode margins.
- Litigation & Regulatory Exposure: Pending litigation regarding prior alleged misstatements was dismissed recently but remains a consideration for governance oversight ([S6]). Cybersecurity protocols have been bolstered but risks persist given data sensitivity.
What To Watch Next
Advance Auto Parts signals its commitment to sustaining FY26 outlook reaffirmed alongside solid quarterly profit performance ([N13], [S3]). Investors should monitor:
- Same-store sales trends indicating underlying demand strength beyond closed stores.
- Progress metrics on supply chain hub conversion impacting service levels and costs.
- Vendor funding updates impacting cost structure or receivable collectibility assessments.
- Pricing dynamics reflecting competitive responses or inflation pass-through capability.
- Merger & acquisition activity remains possible but none explicitly reported currently.
The company’s ability to balance ongoing cost reductions with reinvestment in frontline staff effectiveness will be key execution markers as it seeks durable margin expansion against evolving aftermarket dynamics.
Financial Profile (Latest Quarter Context)
As of April 25, 2026, Advance Auto Parts held about $2.96 billion in cash and equivalents against total debt approximating $3.45 billion recorded as of early January 2026 giving a net debt position near $494 million ([F1],[S2]).
First quarter net sales were stable at roughly $2.61 billion with gross profit around $1.18 billion yielding an improved gross margin percentage supported by reduced inventory markdowns following restructuring actions ([S23],[S25]). Operating income swung positive notably from prior-year losses primarily due to lower restructuring expense allocations ($32 million vs. $118 million) as well as moderate SG&A savings realized through ongoing efficiency measures ([S23],[S25]). Interest expense increased due to higher senior unsecured notes issued during refinancing activities but was partially offset by other income related to transition services stemming from Worldpac’s divestiture finalizations ([S23],[S25]).
Capital expenditures remained controlled at approximately $56 million during the quarter focusing on targeted store enhancements and technology initiatives supporting digital commerce capabilities([S18]). Dividends paid doubled year-over-year reflecting cautious re-investment strategy but share repurchases were non-existent likely due to debt agreement constraints notwithstanding available authorization balances remaining (~$0.9 billion unused) from prior Board approvals ([S22],[S24]).
Overall financial discipline combined with margin recovery bodes well for AAP’s path toward profitability normalization post-restructuring.
This analysis synthesizes recent publicly filed SEC disclosures alongside contemporaneous earnings call commentary without offering any investment advice or research views.
Disclaimer: This is research-only, informational analysis and not investment advice. It may include AI-generated interpretation and general industry context. Always verify important details using primary sources.

Comments