
Asbury Automotive Group in 2026: Margin Compression, Integration Complexity, and the Stakes of Scale in U.S. Auto Retail
Facing a sharp downturn in vehicle sales and profit margins, Asbury Automotive Group must leverage its diversified dealership network, omni-channel investments, and finance and insurance (F&I) platform to counteract industry headwinds and operational risks exacerbated by recent large-scale acquisitions.
Asbury Automotive Group reported an 8% year-over-year revenue decline and a 29% drop in net income for Q3 2026, with margin compression across new and used vehicle sales. The company's ability to realize operational synergies, deepen F&I penetration, and maintain customer loyalty through digital engagement will shape its resilience against macroeconomic and competitive pressures [S2].
Asbury Automotive Group, one of the largest U.S. franchised auto retailers, faces a challenging operating environment in late 2026. The company’s Q3 results reveal broad-based revenue and profit declines, with compressed vehicle margins and lower sales volumes across both new and used segments. The company’s ability to extract value from its scale, deepen finance and insurance (F&I) penetration, and deliver on omni-channel customer experience ambitions will determine whether it can offset industry headwinds and protect profitability.
2026 Snapshot: Revenue Contraction, Margin Pressure, and Post-Acquisition Complexity
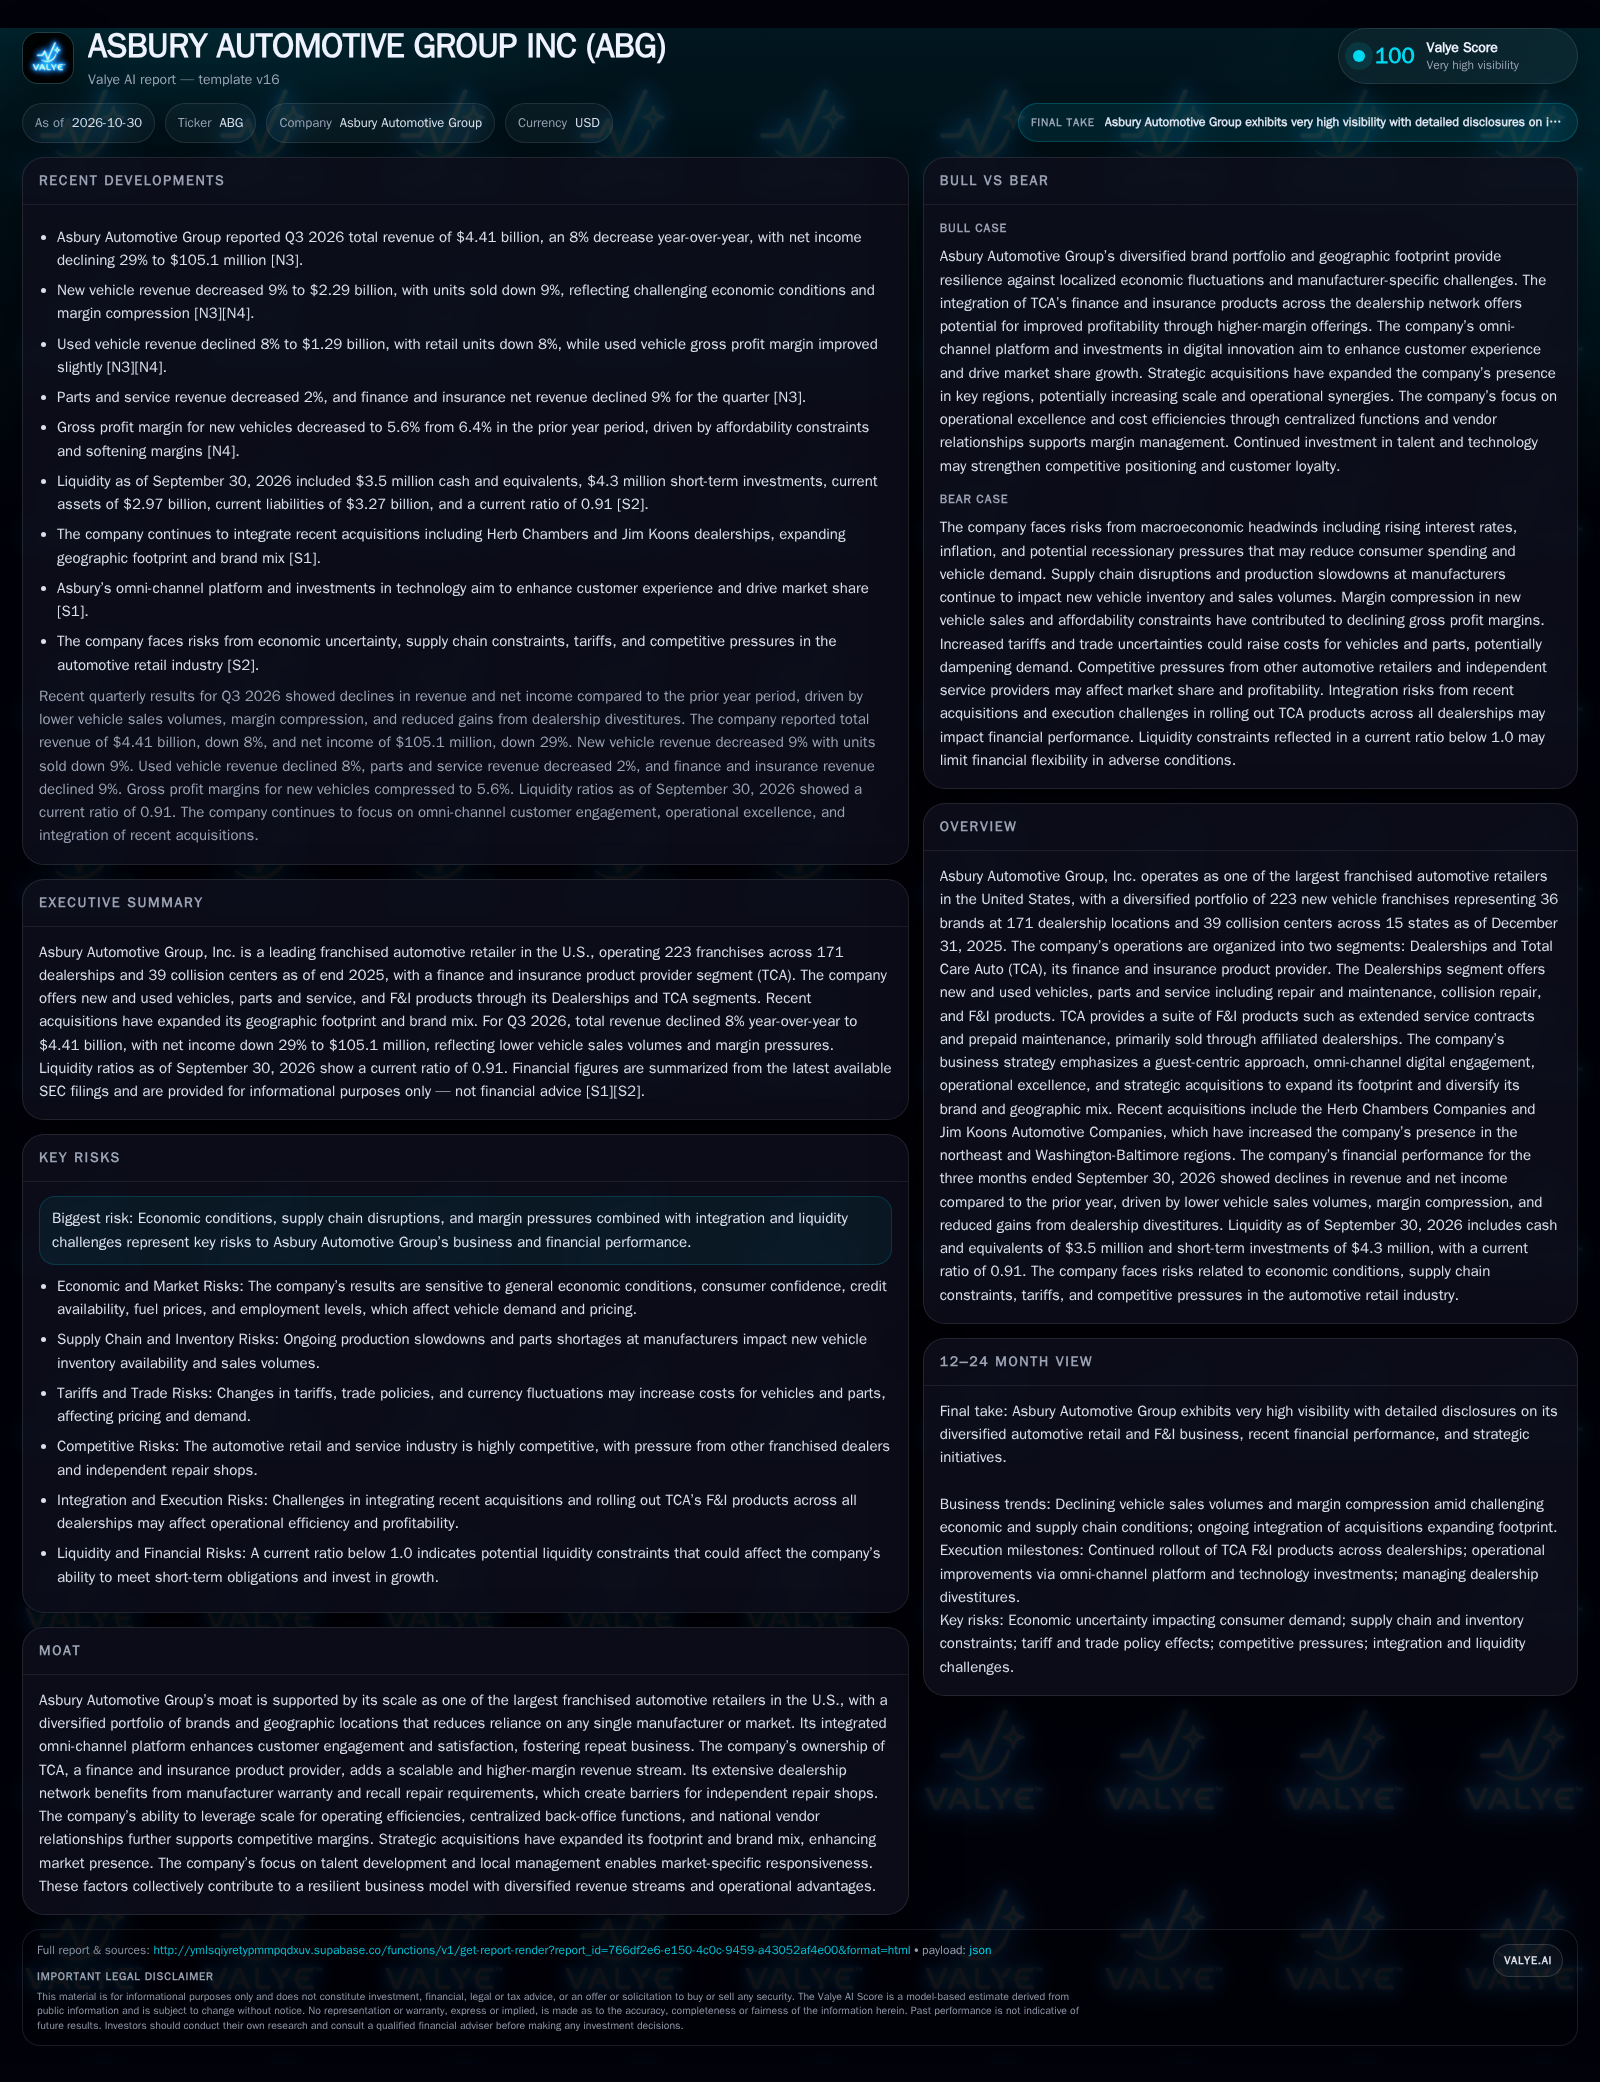
Asbury Automotive Group reported Q3 2026 revenue of $4.41 billion, down 8% year-over-year, with net income falling 29% to $105.1 million. Both new and used vehicle revenues declined by 9% and 8% respectively, while the gross margin on new vehicles dropped to 5.6% from 6.4% in the prior year, highlighting intensified margin compression. The company reported a current ratio of 0.91 for the period.
How Asbury Earns: Multi-Segment Revenue Streams and the Economics of Scale
Asbury’s economics are built on a diversified mix of revenue streams spanning new and used vehicle sales, parts and service, and F&I products. The Dealerships segment generates the bulk of revenue but faces high capital intensity, significant working capital requirements, and exposure to vehicle price volatility. Margins on new vehicle sales are thin and cyclically sensitive, while used vehicle operations can offer higher per-unit margins but are subject to inventory sourcing and pricing risk. The parts and service business—supported by manufacturer warranty and recall work—typically delivers steadier, higher-margin revenue, benefiting from the increasing complexity of modern vehicles.
The Total Care Auto (TCA) segment represents an important profit lever: F&I products such as extended service contracts and prepaid maintenance generally carry higher margins than vehicle sales. Deepening F&I penetration, especially via proprietary offerings, could boost overall profitability if Asbury can successfully integrate TCA across its expanded dealership base. Operating leverage is a double-edged sword: scale can drive efficiency gains, but fixed costs and acquisition-related integration expenses amplify downside risk in periods of declining sales. The company’s capital needs are also shaped by real estate investments and ongoing technology upgrades to support omni-channel engagement.
The capital intensity inherent in Asbury's dealership operations also introduces a nuanced risk-return tradeoff. Investments in inventory and real estate tie up significant funds that could otherwise be deployed for technology upgrades or marketing initiatives. This dynamic becomes particularly critical during periods of sales contraction, as fixed costs remain largely unchanged while revenue declines, compressing margins further. Moreover, the working capital cycle in auto retail is sensitive to shifts in consumer demand and manufacturer production schedules, which can create timing mismatches that strain liquidity. Understanding the interplay between capital allocation decisions and operational flexibility is essential for assessing Asbury's capacity to weather cyclical downturns.
Scale, Digital Engagement, and Brand Diversity: Offsetting Intense Industry Competition?
Asbury’s competitive position is anchored by its scale as one of the largest U.S. franchised dealership groups, a broad portfolio of 34 brands, and a geographic footprint spanning 14 states as of September 2026. This diversity reduces exposure to individual manufacturers or local market downturns, and positions Asbury to benefit from cross-brand synergies and centralized procurement. The company’s omni-channel platform aims to integrate online and in-store experiences, meeting evolving consumer expectations for digital convenience and transparency.
However, the U.S. auto retail landscape remains fiercely competitive, with pressure from other large dealer groups, regional chains, and increasingly sophisticated independent used-car retailers and service providers. Digital disruptors and direct-to-consumer models (including those from OEMs) threaten to erode traditional dealership advantages, especially in lower-margin vehicle sales. Asbury’s ability to leverage its guest-centric approach, scale-driven efficiencies, and proprietary F&I platform may provide partial insulation, but the magnitude of these advantages will be tested as industry dynamics shift and as recent acquisitions must be fully integrated.
The geographic and brand diversification that supports Asbury's competitive position also introduces complexity in standardizing customer experience and operational processes. While cross-brand synergies can reduce procurement costs and enable shared services, they may also dilute brand-specific marketing effectiveness or complicate inventory management. Additionally, the omni-channel strategy's success depends on seamless integration of digital and physical touchpoints, which requires robust IT infrastructure and staff training across diverse locations. The competitive pressure from digital-first entrants underscores the importance of agility in adopting emerging technologies and tailoring offerings to shifting consumer preferences, which may vary significantly across different markets and demographic segments.
Unlocking Synergies: What It Would Take for Acquisitions and F&I to Drive a Profit Rebound
A favorable scenario for Asbury would require the successful integration of the Herb Chambers and Jim Koons acquisitions, realizing cost and revenue synergies through centralized operations, cross-selling, and talent retention. If Asbury can materially increase F&I penetration—especially via TCA-branded products—across its enlarged dealership base, higher-margin F&I revenue could offset some of the margin compression in vehicle sales. Effective deployment of omni-channel technology could enhance customer satisfaction and retention, driving repeat business and supporting higher average transaction sizes.
Confirmation of this scenario would come from a stabilization or rebound in total gross margin, growth in F&I revenue per vehicle retailed, and evidence of cost reductions or operating leverage gains in quarterly financials. A reversal in the trend of declining unit sales, particularly if achieved without sacrificing margin, would signal that Asbury’s scale and digital investments are yielding competitive benefits.
Beyond integration and F&I penetration, unlocking value from acquisitions may also hinge on optimizing organizational structure and culture alignment. Mergers often face challenges in harmonizing disparate management practices and employee incentives, which can impact morale and productivity. If Asbury can establish clear performance metrics and foster a unified corporate culture emphasizing customer-centricity and operational excellence, it could accelerate synergy realization. Furthermore, leveraging data analytics to personalize marketing and service offerings may enhance customer lifetime value and differentiate Asbury in a commoditized market. The scalability of such initiatives across an expanded footprint will be a critical determinant of long-term profitability.
Navigating Margin Compression with Incremental Efficiency Gains
The most plausible trajectory for Asbury over the next several quarters is one of modest improvement but continued headwinds. Vehicle sales volumes may remain subdued due to affordability constraints, high interest rates, and macroeconomic uncertainty. Margin pressure is likely to persist as OEM incentives remain limited and consumers become more price-sensitive. Ongoing integration of recent acquisitions will consume management attention and generate both synergies and frictional costs.
Incremental gains in F&I penetration and modest improvements in operating efficiency—enabled by scale and technology—could help stabilize profitability, but are unlikely to fully offset the structural pressures on core dealership economics. Confirmation of the base case would be a slow improvement or stabilization in revenue and margins, with F&I and parts/service providing a growing share of profit. Falsification would come from continued sequential declines in unit volumes, further margin erosion, or unanticipated integration setbacks.
In a scenario of continued margin pressure, Asbury's ability to fine-tune pricing strategies and optimize inventory mix will be crucial. Balancing the tradeoff between volume and margin requires granular market insights and flexible supply chain management, especially given the volatility in used vehicle sourcing costs. Incremental operational efficiencies might also be achieved through process automation and enhanced vendor negotiations, but these gains may be offset by inflationary cost pressures in labor and logistics. Additionally, sustaining customer engagement through loyalty programs and targeted promotions could mitigate churn, but their effectiveness will depend on execution quality and the evolving competitive landscape. Monitoring these dynamics will provide early signals of whether the company can maintain financial stability amid structural headwinds.
Integration Stumbles and Prolonged Demand Weakness Exacerbate Financial Strain
A negative outcome for Asbury would be driven by a combination of persistent macroeconomic weakness, further declines in new and used vehicle sales, and operational setbacks in integrating acquired dealerships. If F&I penetration stalls or declines—due to regulatory changes, consumer pushback, or execution issues—profitability would be doubly pressured.
Testing the Thesis: Metrics That Will Reveal Asbury's True Resilience
Sequential trends in total gross profit margin, especially the mix between vehicle sales and F&I/parts & service, will clarify whether margin pressures are abating.
F&I revenue per vehicle retailed—if disclosed—would reveal progress in cross-selling and TCA integration across the broader dealership network.
Same-store sales growth (by segment) would help isolate organic demand trends from acquisition-driven expansion.
Integration costs and realized synergies from the Herb Chambers and Jim Koons acquisitions should be tracked for evidence of operational discipline and value creation.
Customer satisfaction and retention metrics—if disclosed—would test the effectiveness of omni-channel and guest-centric initiatives.
Competitive developments in digital retailing or direct-to-consumer models from OEMs and large independents could signal accelerating industry disruption.
Any asset sales, dealership divestitures, or material changes in capital allocation strategy would provide insight into management’s response to financial or operational stress.
Disclaimer: This is research-only, informational analysis and not investment advice. It may include AI-generated interpretation and general industry context. Always verify important details using primary sources.

Comments