
Applied Materials Consolidates Leadership with Strong Quarterly Growth and Cash Position
Applied Materials reported strong operational stability and a robust financial position in its latest quarterly filing, supporting ongoing demand from AI-driven semiconductor manufacturing.
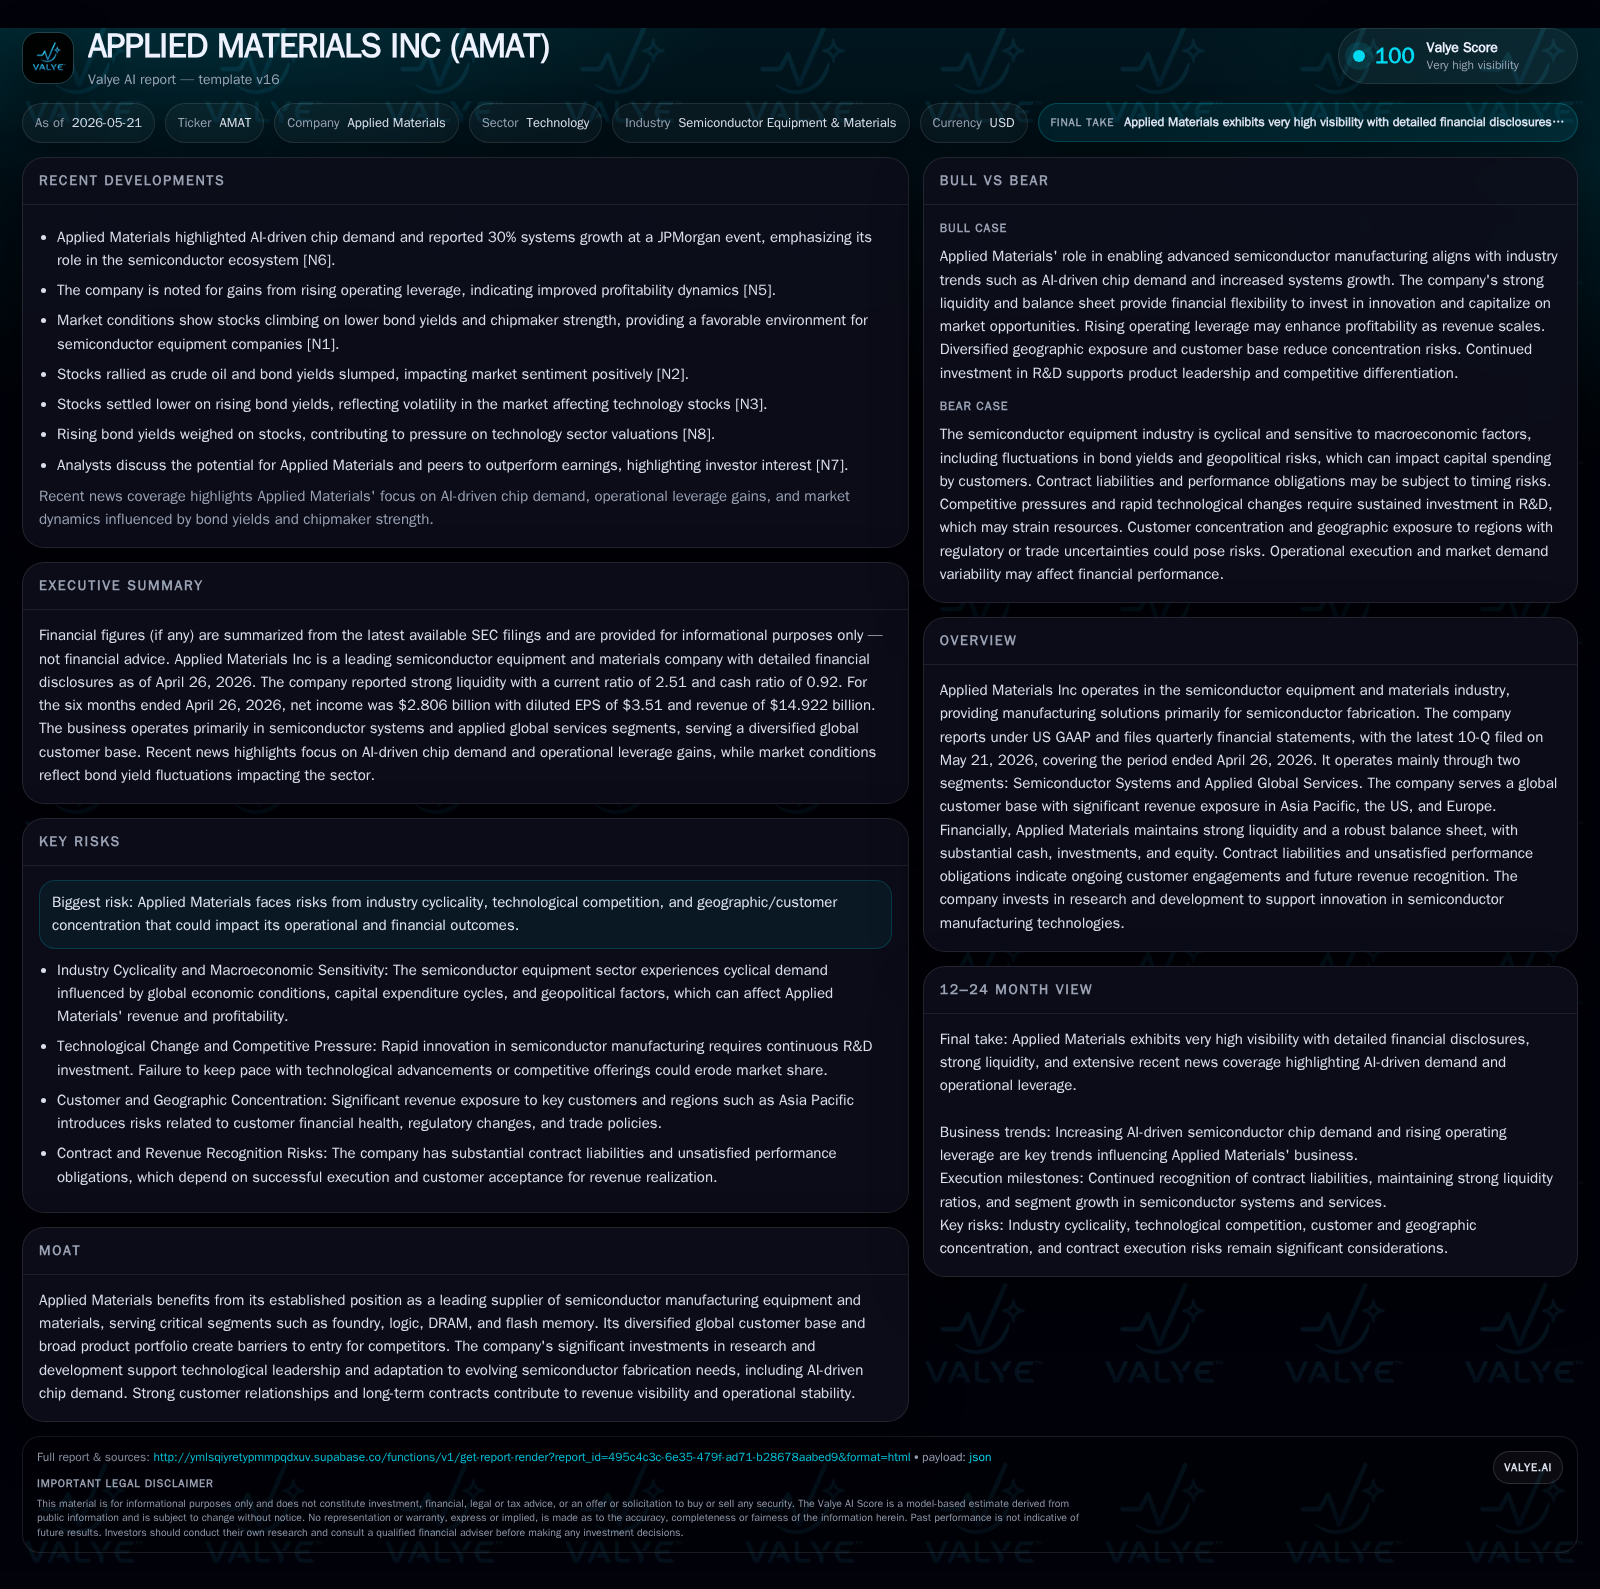
In its Q2 2026 10-Q filing, Applied Materials confirmed non-material impact from derivative instruments and announced a $2 billion revolving credit facility with an option to expand, underpinning liquidity amid robust demand. The company’s revenue drivers remain anchored in its Semiconductor Systems segment fueled by AI chip growth and capacity expansions. Applied Materials’ broad product portfolio, significant R&D investment, and global customer footprint reinforce its competitive moat despite cyclicality and geopolitical risks. The balance sheet remains strong with over $6 billion cash and no material debt draws, enabling operational flexibility as AI-driven semiconductor capex accelerates.
Latest Quarterly Operating Highlights and Significance
Applied Materials’ Q2 2026 10-Q filing dated May 21 highlights key financial stability factors underpinning current operations [S2]. There were no material gains or losses on derivatives used for cash flow or fair value hedging during the three and six months ended April 26, 2026, indicating minimal earnings volatility related to market risks [S2]. The company also disclosed a new $2.0 billion committed revolving credit agreement initiated in September 2025 with a one-year term expiring in September 2026. This facility includes an option to increase commitments by up to $1.0 billion subject to lender approvals—reflecting proactive liquidity management designed to support operational needs amid dynamic industry conditions [S2]. No borrowings under this or other credit facilities are currently outstanding as of the filing date [S15], indicating ample internal funding sufficiency.
The revolving credit facility provides Applied Materials optionality to flex capital access during periods of increased semiconductor manufacturing equipment demand or potential market disruptions. Together with a stable derivative position devoid of significant mark-to-market impacts, this financial posture suggests the company is well-positioned for steady execution in the near term.
Applied Materials’ Business Model and Product Excellence
Applied Materials generates the majority of its revenue through sales of capital equipment and materials integral to semiconductor fabrication [S1]. The company's business is organized primarily into two segments: Semiconductor Systems and Applied Global Services. Semiconductor Systems encompasses capital equipment offerings tied to front-end wafer processing used in logic, memory (DRAM), foundry, and flash memory manufacturing—critical nodes which are central to modern chip fabrication [S1]. This segment drives most revenue due to high-value machinery sales aligned with fab expansions.
Applied Global Services constitutes aftermarket service contracts, spare parts supply, maintenance, productivity upgrades, and performance optimization services [S1]. This recurring revenue stream improves customer stickiness and enhances overall margin stability by extending the life cycle value of installed equipment.
A defining feature of Applied Materials’ model is sustained investment in research & development. The company channels substantial funding into R&D aimed at next-generation fabrication technologies tailored to meet evolving semiconductor process complexities—particularly those required for advanced AI chips demanding greater transistor density and wafer throughput efficiency [S1]. This strategic focus ensures Applied Materials remains ahead of node transitions critical for customers competing in high-performance computing arenas.
Competitive Positioning Within the Semiconductor Equipment Industry
Within the semiconductor equipment landscape—characterized by rapid technological shifts and capital-intensive cycles—Applied Materials maintains a leading competitive position driven by scale, breadth of product portfolio, diverse customer base, and deep technological expertise [S1]. The company serves globally diversified fabs covering multiple geographies including Asia Pacific (notably Taiwan, South Korea), North America, and Europe [S4]. This geographical spread tempers regional risk while positioning the company to capture capacity ramp across key megatrends.
Applied Materials’ product range spans multiple process steps—from deposition to etching to metrology—consolidating barriers for more narrowly focused or newer entrants [S1]. While specialized vendors compete on particular technology fronts (e.g., extreme ultraviolet lithography or niche metrology), AMAT leverages integration capabilities alongside comprehensive lifecycle services that enhance switching costs.
That said, competitive pressure persists especially as demand cycles fluctuate alongside end-market dynamics like consumer electronics versus enterprise compute expansions. Geopolitical factors impacting trade policies also represent potential headwinds given the concentration of semiconductor manufacturing clientele in East Asia [S1]. Nevertheless, AMAT’s established relationships with foundries and leading logic/memory chip producers underpin long-term structural demand visibility.
Growth Catalysts Fueling Systems Segment and AI Chip Demand
A central growth vector for Applied Materials relates to surging AI-driven semiconductor capex underpinning fab investment cycles [N3][S2]. At the recent JPMorgan event noted on May 20 news sources, Applied highlighted approximately 30% year-over-year growth in its Semiconductor Systems revenues reflecting robust uptake driven by hyperscalers’ compute expansion needs as well as strategic foundry node transitions [N3].
Advanced-node wafers require increasingly sophisticated deposition, etch, inspection tools—the core offerings within AMAT’s systems segment—thus driving sharp demand increases compared to legacy process nodes. Hyperscale providers' push for higher compute power amplifies this effect through volume production intensification at cutting-edge geometries.
Additionally, enduring demand patterns emerge from memory segments such as DRAM due to persistent scaling requirements supporting AI workloads. Combined with durable service contracts managed via Applied Global Services providing ongoing aftermarket revenue streams tied to installed base capacity utilization improvement, these growth drivers collectively strengthen topline prospects beyond mere cyclical factors [S1][N3]
Risks and Constraints Facing Applied Materials’ Expansion
Despite structural tailwinds from AI chip demand and equipment upgrades, Applied remains subject to several risks affecting growth scalability. Semiconductor equipment tends toward notable cyclicality due to volatile fab capital spending budgets influenced by macroeconomic climate shifts or inventory adjustments across foundry customers [S1].
Competitive threats arise from emerging technology providers focusing on specific toolsets potentially eroding pricing power or market share if they pioneer disruptive process breakthroughs faster than incumbents [S1]. Geographic concentration in Asia-Pacific introduces exposure risks related to trade restrictions or geopolitical tensions affecting client investment timing.
Supply chain complexity underlying advanced equipment assembly also constrains rapid scaling; component shortages or logistics disruptions could delay deliveries impacting customer production schedules.
Operationally, margin compression may result if competitive pricing pressures intensify or if material costs rise beyond anticipated levels despite current favorable derivative management outcomes cited recently [S2]. Vigilance on maintaining efficient cost structures amid scaling R&D investments will be necessary.
Key Upcoming Milestones and What To Monitor
Investor focus should track evolving order backlog trends reported in future quarterly disclosures as proxies for sustained demand momentum post-May quarter results [S2][S3]. The efficacy of R&D translating into commercially viable next-gen platforms feeding into new design wins will be critical signals of continuing leadership at nodes relevant for AI chip manufacture.
Additionally, monitoring any usage or drawdowns on revolving credit lines will provide insights into capital deployment strategy especially if market uncertainties heighten investment needs temporarily [S2][S3]. Shifts in geographic or customer mix can reveal changing industry dynamics tied to geopolitical developments or shifts in hyperscaler capex priorities.
Lastly, management commentary on risk mitigation measures around supply chain flexibility, customer engagement through services expansions, or restructuring initiatives will shed light on operational discipline amid growth aspirations.
Financial Profile: Liquidity, Capital Access, and Balance Sheet Strength
As of April 26, 2026 quarter-end covered by the latest 10-Q filing date May 21 (Q2 FY2026), Applied Materials held cash and cash equivalents exceeding $6.3 billion balanced against outstanding long-term debt around $5.3 billion after current portion adjustments—with net debt implying a modest net cash position close to negative $1.5 billion when considering liquidity sources versus liabilities [F1][S20]. The current ratio stood favorably above 2.5x based on available current assets relative to liabilities supporting strong near-term payment capacity [F1].
No borrowings were drawn under newly executed revolving credit facilities at quarter-end reaffirming robust internal funding sufficiency suited for both organic investments like R&D plus opportunistic moves such as acquisitions or capital expenditures if warranted [S2][S15]. Derivatives-related impacts on earnings remained immaterial reducing short-term financial volatility concerns [S2]. Collectively these financial metrics reinforce Applied’s conservative leverage policy maintaining flexibility amidst cyclical industry nature while backing strategic growth initiatives related particularly to AI-enabled fab technology expansions.
This analysis draws exclusively upon recently filed SEC documents as of May 21, 2026 ([S1],[S2],[S3]) supplemented by current corporate news reports ([N3]) without speculative extrapolations beyond presented evidence. It aims at providing an informed sector-specialist perspective rather than predictive investment guidance.
Disclaimer: This is research-only, informational analysis and not investment advice. It may include AI-generated interpretation and general industry context. Always verify important details using primary sources.

Comments