
Driveitaway Holdings Confronts Liquidity and Growth Challenges While Expanding Vehicle Access Network
Driveitaway Holdings is accelerating micro-leasing platform growth amid intensified liquidity constraints and capital demands in the evolving vehicle access market.
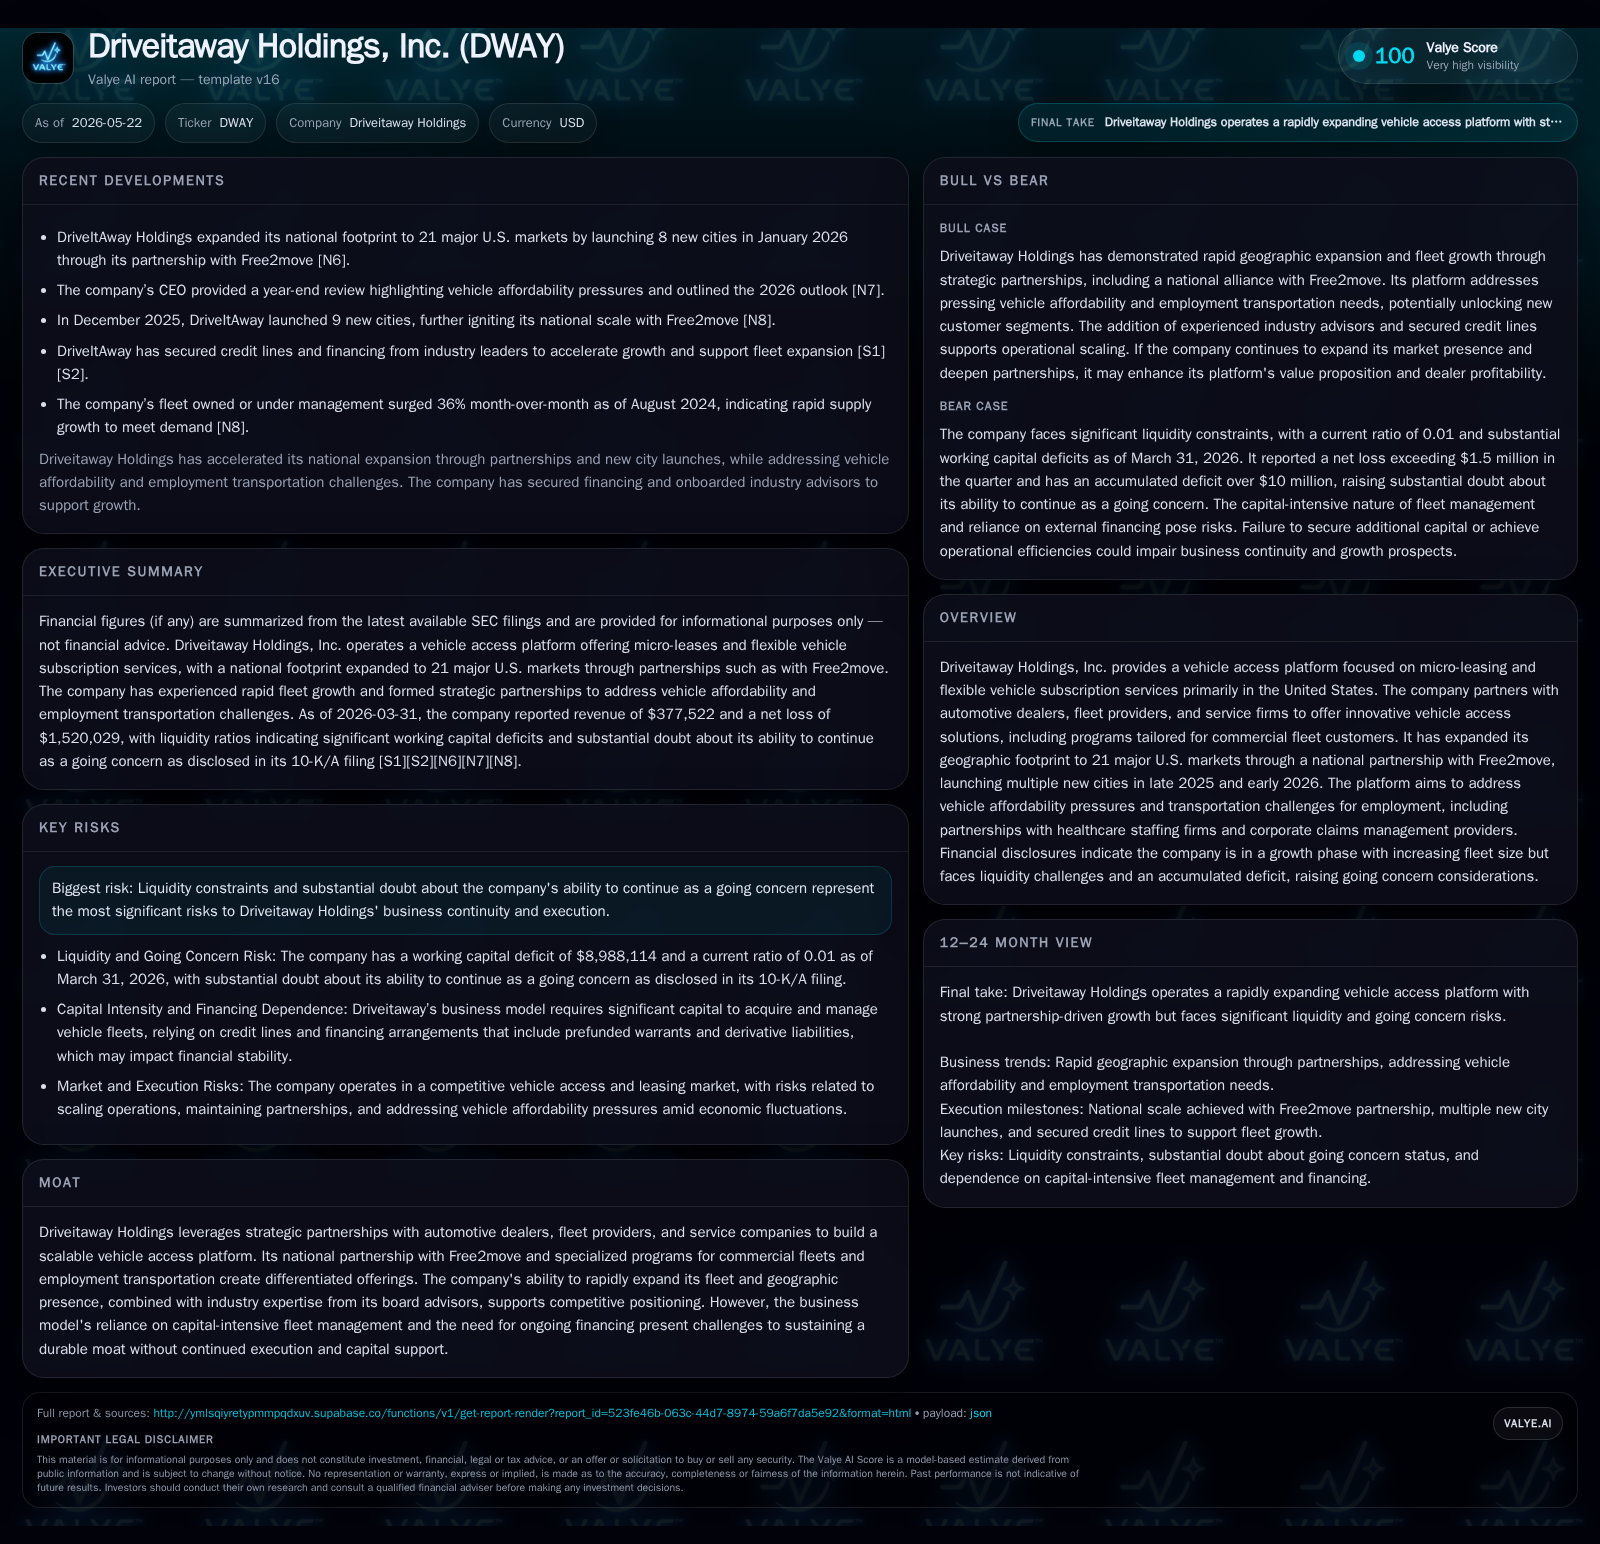
In its latest quarterly filing ending March 2026, Driveitaway Holdings reported notable fleet expansion and geographic market launches through a strategic national partnership with Free2move, boosting its vehicle micro-leasing platform across 21 U.S. cities. However, this growth comes alongside critical liquidity shortfalls highlighted by an extremely low current ratio and a multi-million-dollar working capital deficit, raising substantial going concern doubts. The company’s business model—centered on flexible vehicle access via micro-leasing and subscription services—relies heavily on capital intensive fleet scaling supported by dealer and commercial partnerships. While these alliances provide some moat characteristics, ongoing financial strain and dependence on financing present significant execution risks. Monitoring subscriber growth rates, fleet utilization, and planned financing rounds will be key to assessing Driveitaway’s ability to balance growth ambitions with solvency.
Latest Quarterly Operating Update: Growth Momentum Meets Financial Strain
Driveitaway Holdings’ 10-Q filing for the quarter ended March 31, 2026 highlights meaningful operational progress juxtaposed against critical financial headwinds [S2]. The company expanded its vehicle micro-leasing platform into 21 major U.S. metropolitan markets by leveraging its national partnership with Free2move—a mobility solutions provider with broad dealer network access—achieving multiple city launches in late 2025 and early 2026 [S1]. This broadening footprint aligns with Driveitaway’s strategic push to scale both consumer subscription offerings and specialized commercial fleet programs tailored to sectors such as healthcare staffing and corporate claims management.
However, this expansion accompanies a severe liquidity crunch underscored by only approximately $83,000 in cash & equivalents on hand at quarter-end [F1], total debt near $450,000 as previously reported in late 2025 [F1], coupled with an alarming working capital deficit exceeding $9 million [F1]. The current ratio sits at an exceptionally low level near 0.01 [F1], reflecting critical short-term solvency challenges. These financial stress indicators strengthen prior going concern warnings disclosed in the company’s annual statements [S1].
Revenue generation remains nascent; with the most recent top-line reported around $988,000 for the fiscal year ending September 2025 [F1], the company continues operating at an operating loss position [F1]. This unfinished monetization phase is typical of early-stage platform plays in capital intensive vehicle access models but necessitates urgent liquidity resolution to sustain expansion.
Business Model Overview: Micro-Leasing and Flexible Vehicle Subscriptions
Driveitaway’s business model centers on providing flexible vehicle access through micro-leasing deals and subscription services that reduce traditional barriers of car ownership or long-term leasing commitments [S1]. Customers comprise individual drivers facing affordability constraints alongside commercial clients seeking reliable transportation solutions for their workforce or operational needs.
The company monetizes these services primarily through recurring monthly fees paid by consumers or contractual arrangements with commercial fleets seeking short-term or cyclical vehicle usage options. Critical to this revenue mechanic is Driveitaway’s ownership or control over a growing fleet of vehicles sourced via partnerships with automotive dealers and fleet providers—whose integration affords preferential access to inventory at scale [S1]
Supplementary programs address specific market segments such as healthcare staffing firms needing flexible employee commute options and corporate claims managers requiring managed mobility solutions for client employees. These verticalized offerings deepen product-market fit but also add complexity in delivery requiring tailored service operations.
A notable facet is the capital-intensive nature of owning or controlling vehicles outright rather than being purely asset-light software/service intermediaries, which elongates cash conversion cycles and imposes substantial funding demands. Capital deployed into fleet growth directly ties up funds before monthly subscription revenue streams begin amortizing vehicle costs.
Competitive Positioning and Industry Landscape
Within the emerging vehicle access ecosystem spanning traditional fleet rentals, car sharing, subscription-based mobility services, Driveitaway carves differentiation through its micro-leasing scale-up strategy combined with a national footprint across diversified urban markets [S1]. This spatial breadth contrasts localized competitors who operate narrower geographies limiting potential network effects.
Supply chain constraints in procuring affordable fleet vehicles amid fluctuating auto market dynamics remain an overarching challenge industrywide but partner relationships with dealers help mitigate these supply tightness issues for Driveitaway. Potential pricing power depends on maintaining exclusive or favored channel agreements enabling competitive rate structures while broad adoption raises switching costs given embedded logistics integration.
Technology adoption—such as AI-driven pricing models employed broadly in mobility platforms—presents latent external pressure points that could intensify pricing competition although specifics are unreported here. Overall competitive posture combines transactional flexibility (micro-leasing lengths), geographic reach, targeted vertical solutions, yet remains constrained by capital intensity limiting swift scale compared to asset-light peers.
Partnership-Driven Moat and Differentiated Service Offerings
The cornerstone of Driveitaway’s strategic moat lies in forging robust alliances with automotive dealers, fleet providers, and service firms which collectively support scalable vehicle supply pipelines essential for executing micro-leasing programs nationally [S1], [S2]. Its alliance with Free2move notably expanded coverage into over twenty cities recently, demonstrating operational leverage gained from partnering over direct market-by-market investments.
Complementing scale advantages are partnerships serving commercial clients requiring dedicated fleet management capabilities — translating to higher retention through customization that embeds switching costs within customer operations reliant on employment transportation or corporate claims handling services.
Board advisors bring automotive industry expertise enhancing navigation of operational nuances including fleet acquisition timing, regulatory compliance in subscription offerings nationwide, and execution precision needed for complex multi-market deployments.
Despite these qualities fostering competitive differentiation, the dependency on continued capital influx to maintain fleet ownership levels tempers softness in moat durability absent consistent execution wins.
Drivers Accelerating Demand and Fleet Expansion
Demand-side rationales include persistent transportation affordability pressures faced by lower-income urban populations alongside structural employment trends increasing temporary or contract labor pools requiring mobility solutions [S1]. These dynamics underpin durable secular demand for alternative vehicle access beyond traditional ownership models.
Geographic expansion facilitated by national partnerships permits Driveitaway to tap diverse urban environments with variable demand densities enhancing overall platform utilization potential [S2]. Increased adoption by healthcare staffing firms signals traction within specialized verticals which often have recurring scheduling-based transport needs mirroring subscription convenience benefits.
Fleet expansion rates serve as a proximate KPI reflecting ongoing ability to supply customer contracts efficiently—critical since limited vehicle availability would bottleneck revenue ramp acceleration [S2]. Technology deployments automating booking workflows or usage monitoring also catalyze scale economies required for profitable unit economics long term.
Overall growth prospects hinge on sustaining subscriber acquisition momentum alongside deeper penetration into commercial use cases that afford larger contract values per client versus individual consumers.
Key Risks: Liquidity, Capital Intensity, and Going Concern Uncertainties
The primary risk axis lies in Driveitaway’s fragile liquidity position marked by very low cash reserves ($83K), considerable total debt ($450K as last stated), compounded by a working capital deficit nearing $9 million reflecting immediate funding insufficiency to cover short-term liabilities without new financing [F1], [S2].
This fiscal stress triggers substantial doubt about ability to continue as a going concern—a caveat explicitly noted in both annual filings and echoed in quarterly disclosures signifying non-trivial risk of insolvency or forced deleveraging if capital injections falter [S1], [S2].
Capital intensity inherent from owning rather than brokering vehicles elongates cash burn cycles especially amid delayed margin creation from early-stage subscriptions. Additionally, issuance of pre-funded warrants tied to financing arrangements introduces dilution risk that could impact shareholder value over time if exercised extensively or priced unfavorably [S4], [S5].
Operationally scaling multiple city launches simultaneously entails execution complexity; failure to optimize utilization rates or control operating expenses could exacerbate cash depletion further undermining runway duration.
Monitoring Milestones: Execution Benchmarks and Financial Health Indicators
Key performance indicators to monitor include sequential fleet size growth metrics post each quarter offering insight into capacity build relative to demand fulfillment capability reported at ~21 cities currently [S2]. Subscriber count expansions—if disclosed—would directly evidence market traction though currently unavailable.
Fleet utilization improvements measured as percentage active versus idle units drive revenue efficiencies balancing fixed costs tied to ownership. Marginal cost controls aligned with cost per lease unit inform path toward profitability transitioning from early loss profiles documented historically.
Financially critical events encompass future refinancing rounds addressing working capital gaps or restructuring debt facilities given existing current ratio stresses limiting borrowing capacity organically [F1], [S2]. Transparency regarding warrant conversions or equity injections will signal dilution magnitude implications affecting long-term capital structure viability.
These operational-financial milestones collectively illuminate whether Driveitaway can bridge nascent platform scaling hurdles despite pronounced fiscal constraints.
Financial Snapshot: Capital Structure and Liquidity Profile
As of March 31, 2026 data show Driveitaway holds roughly $83,000 in cash equivalents against current liabilities exceeding $9.2 million resulting in a razor-thin current ratio near 0.01 highlighting acute liquidity shortfall capable of constraining day-to-day operations without immediate infusions of working capital [F1]. Total reported debt stood near $450,000 as last measured end-September 2025 with net indebtedness around $367,000 after accounting for cash balances indicative of modest leverage but overshadowed by daunting short-term obligations [F1].
An accumulated deficit above $10 million underscores prolonged historical losses associated primarily with startup investment phases in platform deployment efforts documented through fiscal year-end September 2025 filings [S1]. These conditions collectively emphasize material uncertainty regarding continued operation absent substantial financial restructuring or successful ramping of recurring revenues sufficient to reverse operating losses sustainably.
This analysis is based on public SEC filings including the latest quarterly report dated May 22, 2026 (Form 10-Q) supplemented by annual disclosures dated January 15, 2026 (Form 10-K/A), along with companyfacts financial snapshots as of March 31, 2026. No investment advice is expressed herein; this report aims solely to evaluate Driveitaway Holdings’ business model dynamics, growth prospects, competitive positioning, risks, and financial context within the vehicle micro-leasing sector.
Disclaimer: This is research-only, informational analysis and not investment advice. It may include AI-generated interpretation and general industry context. Always verify important details using primary sources.

Comments