
Jones Soda Reports First Quarter Return to Profitability Amid Strategic Shift and Distribution Expansion
Q1 2026 results mark a positive net income turnaround as Jones Soda leverages its craft beverage niche and tightens operational control.
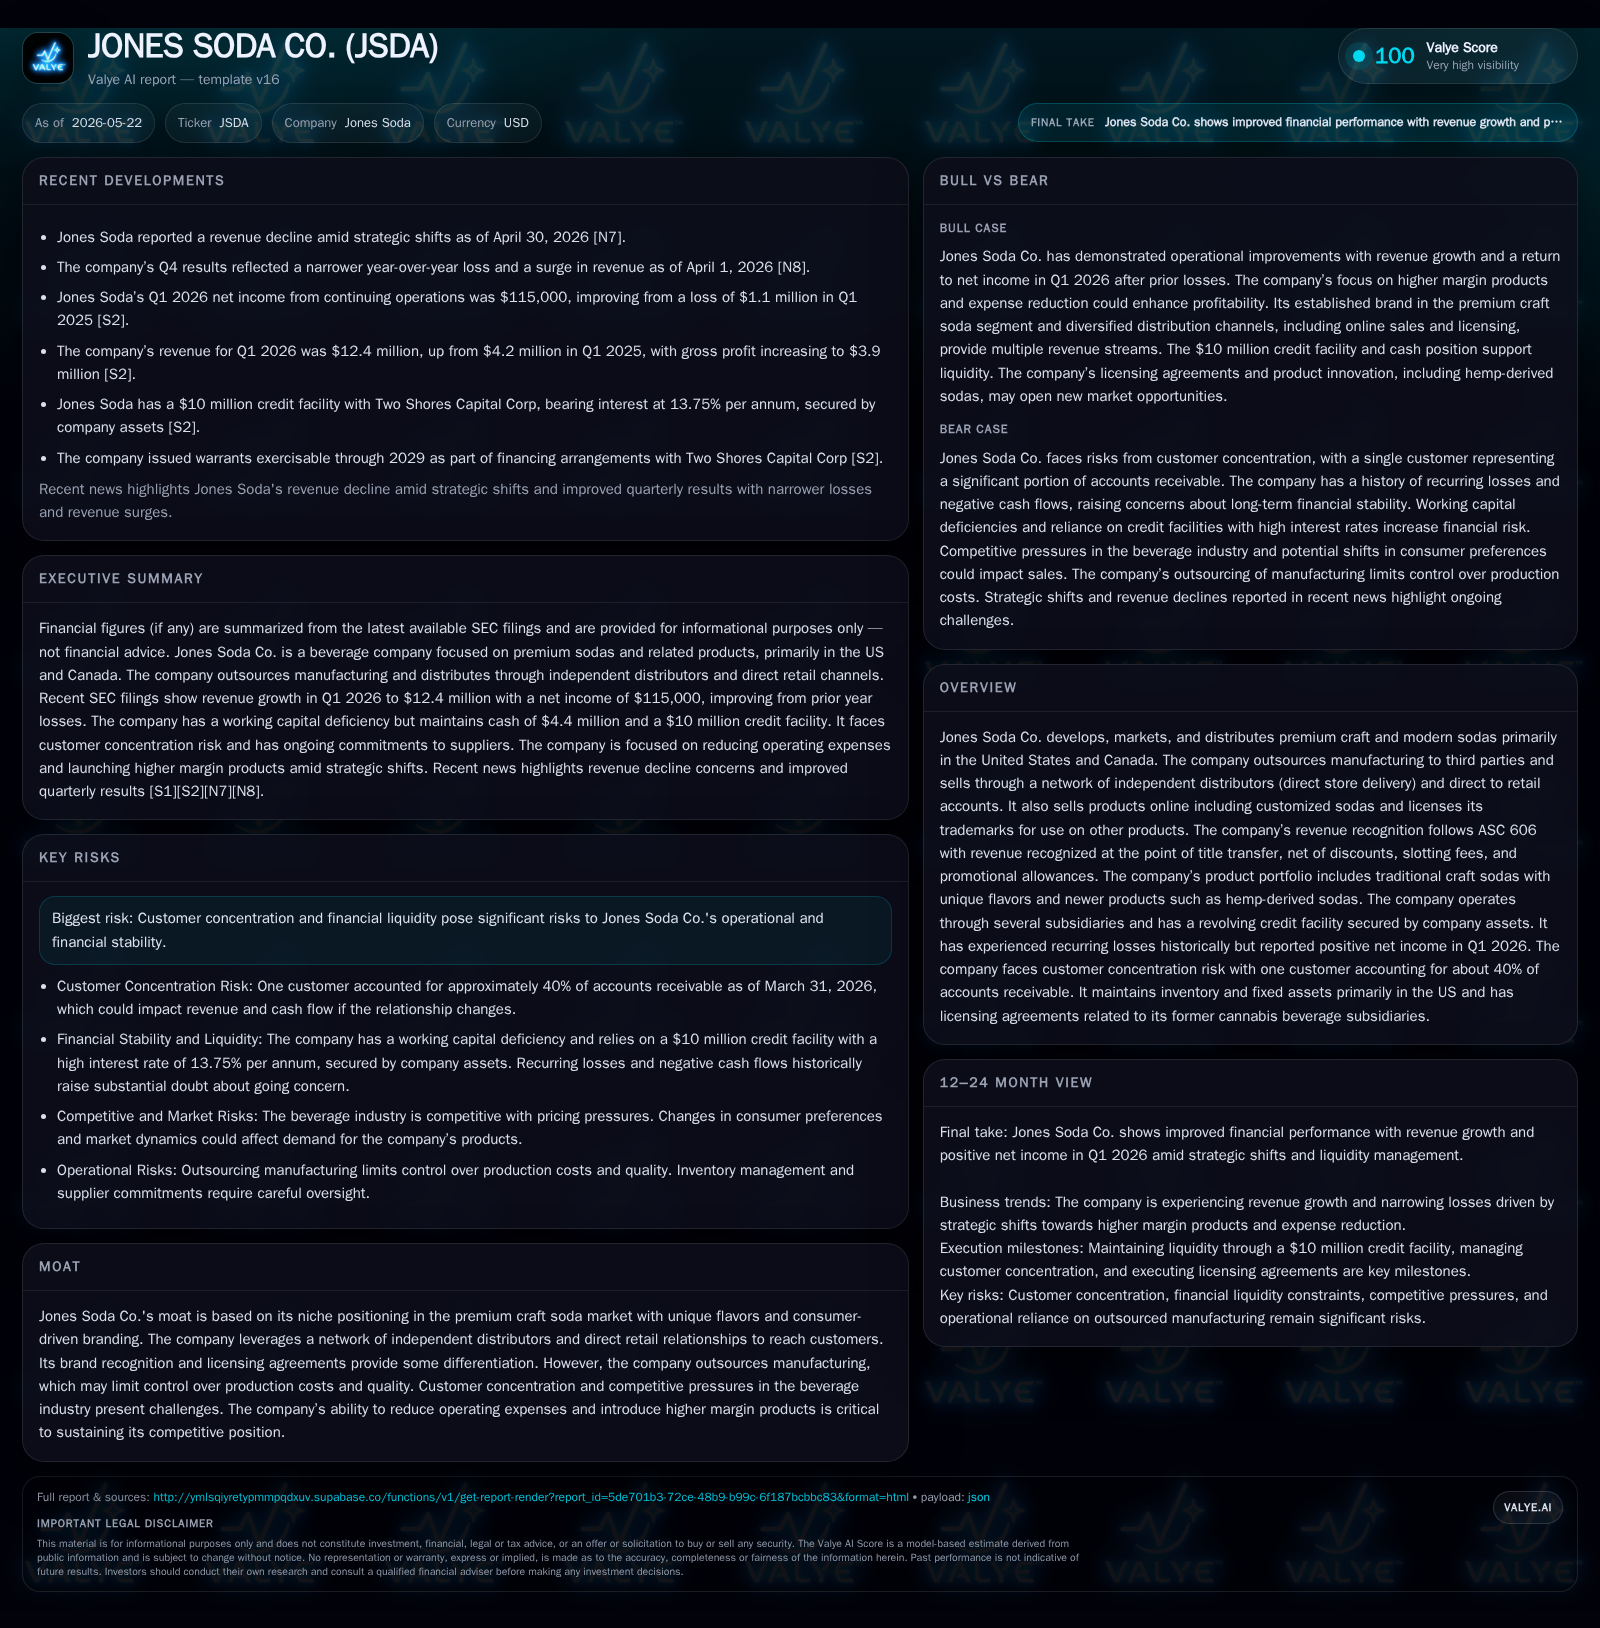
In its latest quarterly filing, Jones Soda Co. reported a return to profitability with $115,000 net income for Q1 2026, reversing prior losses. The company’s business model centers on premium craft sodas distributed through independent networks and direct retail channels, emphasizing unique flavors and branding. Operating in a competitive, trend-sensitive beverage space with outsourced manufacturing, Jones Soda’s growth depends on expanding distribution, improving product margins, and navigating regulatory risks related to hemp-derived products. Liquidity remains tight with a near-unity current ratio and reliance on credit facilities backed by company assets. Monitoring product innovation, distribution scale, and operating expense management will be critical going forward.
Recent Operating Update
Jones Soda Co.'s latest financial disclosure for Q1 ended March 31, 2026 ([S2],[S4],[S20]) reveals a significant operational inflection point marked by reported net income of approximately $115,000 compared to a loss exceeding $1.1 million in Q1 2025. This improvement is underscored by revenue growth from roughly $4.2 million to $12.4 million year-over-year, reflecting expanded sales volume and distribution penetration.
The company highlights ongoing efforts to reduce expenses while prioritizing higher-margin product introductions that align with evolving consumer preferences. Additionally, a recent $2.5 million brokered private placement bolstered liquidity alongside an amended credit facility of up to $10 million from Two Shores Capital Corp bearing high-interest rates at 13.75%, collateralized by company assets ([S5],[S6],[S13]).
Jones Soda maintained working capital near balance neutrality with current assets of about $15.1 million offset against current liabilities of approximately $15.3 million as of quarter end ([F1],[S2]).
Business Model Analysis
Jones Soda operates primarily within the premium craft soda segment focusing on uniquely flavored beverages made predominantly with pure cane sugar and catering to niche consumer tastes seeking authenticity and novelty ([S1]). Products range from its namesake Jones Soda to newer lines featuring hemp-derived ingredients such as HD9—an innovative but heavily regulated category subject to state-level scrutiny notably in California where temporary cessation occurred due to labeling disputes ([S17]).
The company's revenue arises from selling finished beverages to independent distributors who execute direct store delivery alongside relationships with retail chains permitting both traditional shelf placements and direct-to-consumer online sales offering customized bottles ([S10],[S20]). Pricing mechanisms involve fixed consideration per product shipment recognized under ASC 606 at FOB shipping point once title transfers ([S5]).
Manufacturing is fully outsourced to third-party bottlers which curtails capital expenditure but complicates cost control and quality assurance efforts that impact gross margins ([S1]). In Q1 2026, gross margin expanded commensurate with higher sales volume as cost of goods sold increased less proportionally than revenue ([S20]).
Brand engagement benefits from licensing agreements whereby the company monetizes its intellectual property on non-beverage goods and collaborates on select marketing campaigns enhancing consumer visibility beyond traditional outlets ([S1]).
Industry Structure and Competitive Position
Operating exclusively in the beverages sector, Jones Soda targets the specialty soft drink niche characterized by vibrant competition from both legacy soda producers venturing into craft segments as well as a burgeoning field of artisanal producers focused on natural ingredients or functional enhancements ([S10],).
Jones’ competitive moat primarily stems from its differentiated flavor profiles and highly distinctive branding that resonates with younger demographics valuing customization and experiential consumption (). Its geographically diverse US-Canada footprint mitigates some regional volatility though customer concentration risk is notable—one major customer accounts for approximately 40% of outstanding receivables delaying diversification benefits ([S8]).
Outsourcing manufacturing reduces fixed costs but limits operational agility relative to vertically integrated peers who may achieve better scale economies or ingredient sourcing advantages (). Moreover, regulatory complexity surrounding hemp-infused sodas poses entry barriers for competitors wary of compliance costs but also elevates reputational risks for Jones.
Growth Drivers
Strategic growth drivers revolve around broadening distribution partnerships particularly among large retail chains during peak seasonal quarters (April through September), accelerating digital commerce capabilities especially for personalized offerings, and innovating within the premium soda portfolio including further development of hemp-derived beverages pending regulatory clarity ([S1],[S10],).
Sales expansion has shown concrete traction Q/Q owing partly to filling out pipelines for new partners and SKU rationalization enhancing throughput efficiency (). New product launches aligned with trend-conscious consumers foster repeat buying behavior while higher-margin SKUs contribute positively to operating leverage ().
Capitalizing on licensing royalties provides an ancillary revenue stream diversifying sources beyond core product sales (). Meanwhile cost management initiatives targeting SG&A reduction are vital given historical losses threatening sustainability ( [S4],).
Risks / Watchpoints / Growth Constraints
Key risks include:
- Customer Concentration: Heavy reliance on a small number of distributor/retail customers heightens exposure if purchasing priority shifts or payment delays occur ([S8],).
- Liquidity Limitations: Current ratio marginally below parity highlights tight working capital; reliance on expensive credit facilities may restrict operational flexibility during downturns ([S2],[F1]).
- Regulatory Uncertainty: Labeling controversies and THC regulation around hemp-infused sodas create compliance costs, recall risks, and potential market disruptions particularly in key states like California where product withdrawal occurred ([S17],).
- Competitive Pressure: Both from large beverage conglomerates entering craft soda space with deep pockets and agile local players competing on novel health or flavor attributes constraining pricing power ().
- Outsourced Manufacturing Dependency: Limits control over production costs/capacity; potential bottlenecks or quality issues could damage reputation or margin profile ().
Monitoring these factors is essential alongside continued progress in diversifying distribution channels while sustaining brand uniqueness.
What to Watch Next
Investors should track milestones including quarterly revenue growth sustainability especially through the traditionally stronger warm months; progress in securing multi-channel distribution placements; updates on regulatory environment impacts particularly related to hemp ingredients; management’s success in sustaining positive net income through margin improvements; developments regarding customer concentration mitigation; efficient use of proceeds from recent private placement; and any refinements or expansions in licensing agreements that enhance royalty streams.
Execution against these areas will signal whether Jones Soda can solidify its niche position amid broader industry headwinds.
Financial Profile Summary
As of March 31, 2026, Jones Soda held cash balances near $4.44 million supported by increased accounts receivable ($5.26 million) and inventory expansion ($4.15 million) relative to prior periods symbolizing anticipation of demand growth albeit stressing liquidity given simultaneous rises in accrued expenses ($4.27 million) and payables ($7.15 million) leading to a current ratio close to one (0.99) ([F1],[S2]). Net cash used in continuing operating activities declined substantially year over year by approximately $1 million evidencing better working capital management despite investments in inventories supporting sales increases ([S4],[S9]). The company remains reliant on revolving credit facilities totaling up to $10 million procured at relatively high-interest cost secured against all company assets which underlines pressing funding needs but suggests lender confidence conditioned on business plan execution ([S6],[S13], [S5]). Overall profit conversion remains nascent but improves as Jones moves away from historically recurring losses toward narrow profitability demonstrated in Q1.
This analysis synthesizes the latest SEC filings alongside Valye News’ industry expertise focusing strictly on supported data without investment research view—serving purely informational purposes for informed decision-making.
Disclaimer: This is research-only, informational analysis and not investment advice. It may include AI-generated interpretation and general industry context. Always verify important details using primary sources.

Comments