
Arrow Financial's Profit Surge and Strategic Acquisition Sharpen Regional Banking Foothold
Robust loan portfolio growth, margin expansion, and a transformative merger position Arrow Financial Corp for continued regional strength.
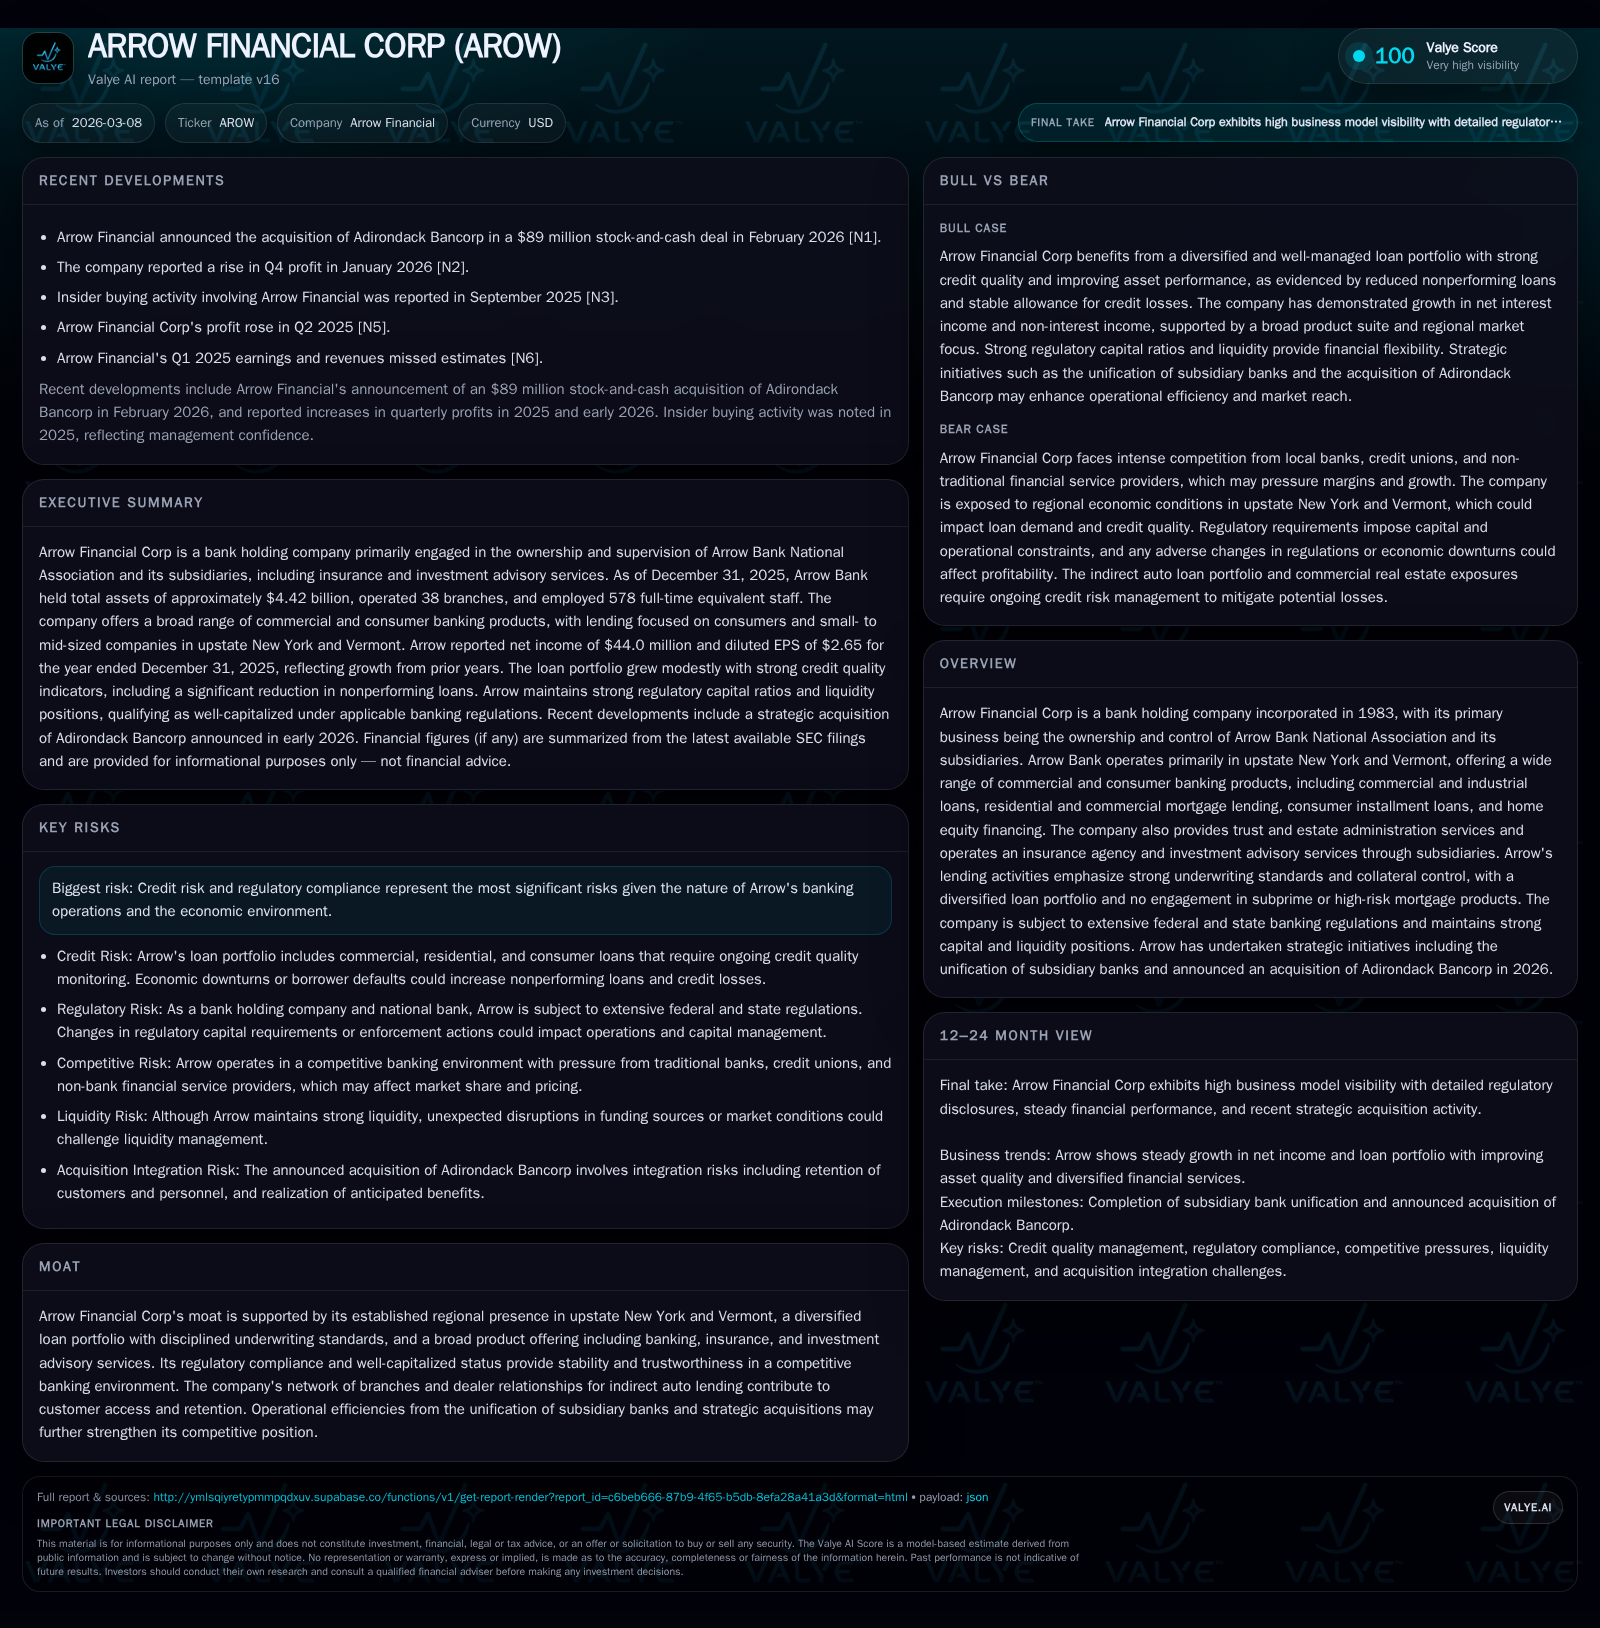
Arrow Financial Corp delivered a substantial earnings increase in 2025, driven by higher net interest income and disciplined credit risk management. The company’s acquisition of Adirondack Bancorp, announced in early 2026, marks a pivotal step in expanding its presence in upstate New York. Operational consolidation following recent subsidiary unification underpins efficiency gains. Sound capital ratios and active capital allocation via dividends and share repurchases highlight financial stability. Key risks remain tied to credit exposure and regulatory oversight within its core regional banking markets.
Company Overview and Historical Performance
Arrow Financial Corp operates as a bank holding company primarily through its wholly owned subsidiary, Arrow Bank National Association, alongside several financial service subsidiaries including insurance and investment advisory arms. Founded in 1983, it maintains a concentrated regional footprint in upstate New York and Vermont.
Over the past three years leading to fiscal year-end (FY) 2025, Arrow has shown solid profitability and balance sheet growth. Net income surged to $43.95 million in FY2025 from $29.7 million in FY2024—a nearly 48% rise—marking its strongest performance since at least 2019 [F1][S1]. This uplift is underscored by expanding net interest income rising from $111.7 million to $133.2 million within the same period alongside improved net interest margins (NIM) moving from roughly 2.72% to 3.17% [S1][S24].
Historical performance (annual)
| FY | Net ($mm) | CFO ($mm) | Capex ($mm) | Net YoY |
|---|---|---|---|---|
| 2025 | 44 | 41 | 5 | +47.9% |
| 2024 | 30 | 34 | 6 | -1.2% |
| 2023 | 30 | 21 | 7 | -38.4% |
| 2022 | 49 | 60 | 14 |
Source: SEC companyfacts cache [F1].
Capital returns and efficiency (annual)
| FY | Buybacks ($mm) | FCF ($mm) | ROE% |
|---|---|---|---|
| 2025 | 10 | 36 | 10.2 |
| 2024 | 7 | 29 | 7.4 |
| 2023 | 4 | 13 | 7.9 |
| 2022 | 3 | 45 | 13.8 |
Source: SEC companyfacts cache [F1].
*Approximated from dividend per share (DPS) multiplied by shares outstanding.
Despite steady revenue performance since FY2023, the pronounced jump in FY2025 primarily reflects fruitful adjustments in asset yields coupled with nimble liability cost management.
Loan Portfolio Composition & Credit Quality
Arrow adopts a conservative credit stance emphasizing collateral security and thorough underwriting across diverse loan types:
- Commercial & Commercial Real Estate Loans: These make up approximately one-third of the portfolio (about 29% combined), concentrated on small- to mid-sized companies within its core markets; limited exposure to typically volatile office/retail sectors mitigates risk concentration [S6][S19].
- Consumer Loans: Constituting around one-third of the portfolio are auto loans largely generated through an extensive dealer network covering broader New York and Vermont regions; loans are tiered by credit risk under stringent criteria [S6][S9].
- Residential Real Estate Loans: Making up just over forty percent of lending, this segment includes conventional mortgages and home equity lines; while some originations are sold into secondary markets like Freddie Mac, servicing rights are generally retained [S9][S13].
Credit quality metrics remain robust with net charge-offs low at roughly 0.19% of average loans in FY2025, slightly elevated provisions for credit losses reflective of measured reserve increases for particular CRE participations that transitioned out of direct loan classification but remain earnings-generative as LLC investments [S1][S15]. Nonperforming assets also declined materially from prior years.
Regulatory Capital & Liquidity Position
Arrow’s capitalization consistently exceeds regulatory minimums by wide margins: Tier 1 leverage sits at around 9.68% versus the required minimum of 4%; total risk-based capital exceeds both minimum thresholds and conservation buffers reinforcing "well-capitalized" status [S10][S21].
Liquidity is maintained through a diversified set of sources:
- Over $185 million held as cash or cash equivalents at year-end plus $496 million available-for-sale securities provide immediate liquidity buffers;
- Contingent borrowing capacity totals approximately $1.4 billion including Federal Home Loan Bank lines and Federal Reserve discount window options;
- Brokered deposits account for about $300 million offering stable funding complementing core deposits drawn mostly from local communities served [S4][S5][S12].
Stress testing protocols reinforce readiness for various adverse scenarios.
Recent Strategic Moves & Future Growth Drivers
A major strategic development occurred on February 25th, 2026 with Arrow announcing the acquisition of Adirondack Bancorp for about $89 million via stock-and-cash consideration [N1][S3]. This deal expands branch networks and market penetration congruent with Arrow’s emphasis on regional dominance.
Operationally, the company benefits from efficiencies realized after previously merging two subsidiaries into one unified banking institution as of December 31st, 2024—simplifying infrastructure and enhancing customer engagement cohesiveness [S12].
Potential growth catalysts include:
- Expansion of indirect automobile loan programs leveraging dealer ties across an extended geography;
- Increased mortgage origination volumes amid remaining demand strength despite higher rate environments;
- Cross-selling opportunities across insurance and investment advisory services embedded within community banking relationships.
Conversely, growth is tempered by macroeconomic risks influencing borrower creditworthiness, competitive intensity especially from fintech entrants disrupting conventional channels, housing affordability issues locally impacting mortgage dynamics, and ongoing regulatory scrutiny necessitating cautious operational approaches.
Capital Allocation & Shareholder Returns
Arrow has pursued a balanced capital return approach combining dividend increments with opportunistic share repurchases:
- Dividend per share grew modestly to $1.14 in FY2025 from $1.09 in prior year;
- Share repurchases accelerated markedly with over $10 million spent during FY2025 compared to $6.79 million a year earlier reflecting confidence in capital sufficiency [F1][S14][S16].
Operating cash flow generation supports this strategy strongly—CFO rose almost twenty percent year-on-year to over $41 million while capital expenditures declined slightly enhancing free cash flow availability around $36 million annually recently [F1].
Return on equity based on headline figures approximates just over ten percent infused with steady book value growth evidencing effective reinvestment decisions alongside shareholder remuneration.
Risk Considerations & Industry Context
Principal risks stem from credit challenges inherent to banking operations amplified by regional economic dependencies—Arrow carefully monitors problem loan classifications which remain manageable but require vigilance especially given selected CRE exposures undergoing restructuring interventions [S15][S22]. Regulatory compliance burden persists as substantial given federal/state oversight frameworks shaping permissible activities especially post-merger expansions [S7][S25]. Competitive pressure emanates not only from traditional peers but also increasingly sophisticated non-bank financial firms leveraging less constrained product offerings impacting market share potential.
Industry practice trends such as digital banking adoption continue reshaping customer engagement models motivating Arrow’s investment in employee development platforms like Arrow University fostering talent alignment with evolving service expectations [S25].
Conclusion & Outlook Analysis
Arrow Financial Corp’s latest annual performance underscores effective execution on multiple fronts: profit expansion fueled by expanded net interest margins; disciplined credit policies maintaining asset quality; robust capitalization fostering flexibility; strategic acquisition pursuit amplifying regional relevance; consistent shareholder-focused capital deployment balancing dividends with buybacks.
Key indicators going forward include:
- Progress integration outcomes post-Adirondack acquisition capturing expected operational synergies;
- Continued loan portfolio mix management catering prudently to local economic fundamentals without venturing into high-risk mortgage products;
- Maintenance of liquidity buffers sufficient for stress scenarios given potential volatility;
- Monitoring regulatory changes that could influence capital or business model constraints.
Absent explicit forward guidance disclosures beyond transaction announcements or milestone projections for integration phases provided so far, these focal areas frame what investors should watch accompanying routine quarterly updates.
This report synthesizes available data without prescribing investment action or price forecasts concerning Arrow Financial Corp securities or financial instruments issued by the company.
Disclaimer: This is research-only, informational analysis and not investment advice. It may include AI-generated interpretation and general industry context. Always verify important details using primary sources.

Comments