
KRONOS Worldwide's Turnaround Stalls as Operating Losses Deepen in 2025
After years of volatility, KRONOS Worldwide posted a significant operating loss in 2025, challenging its path to consistent profitability.
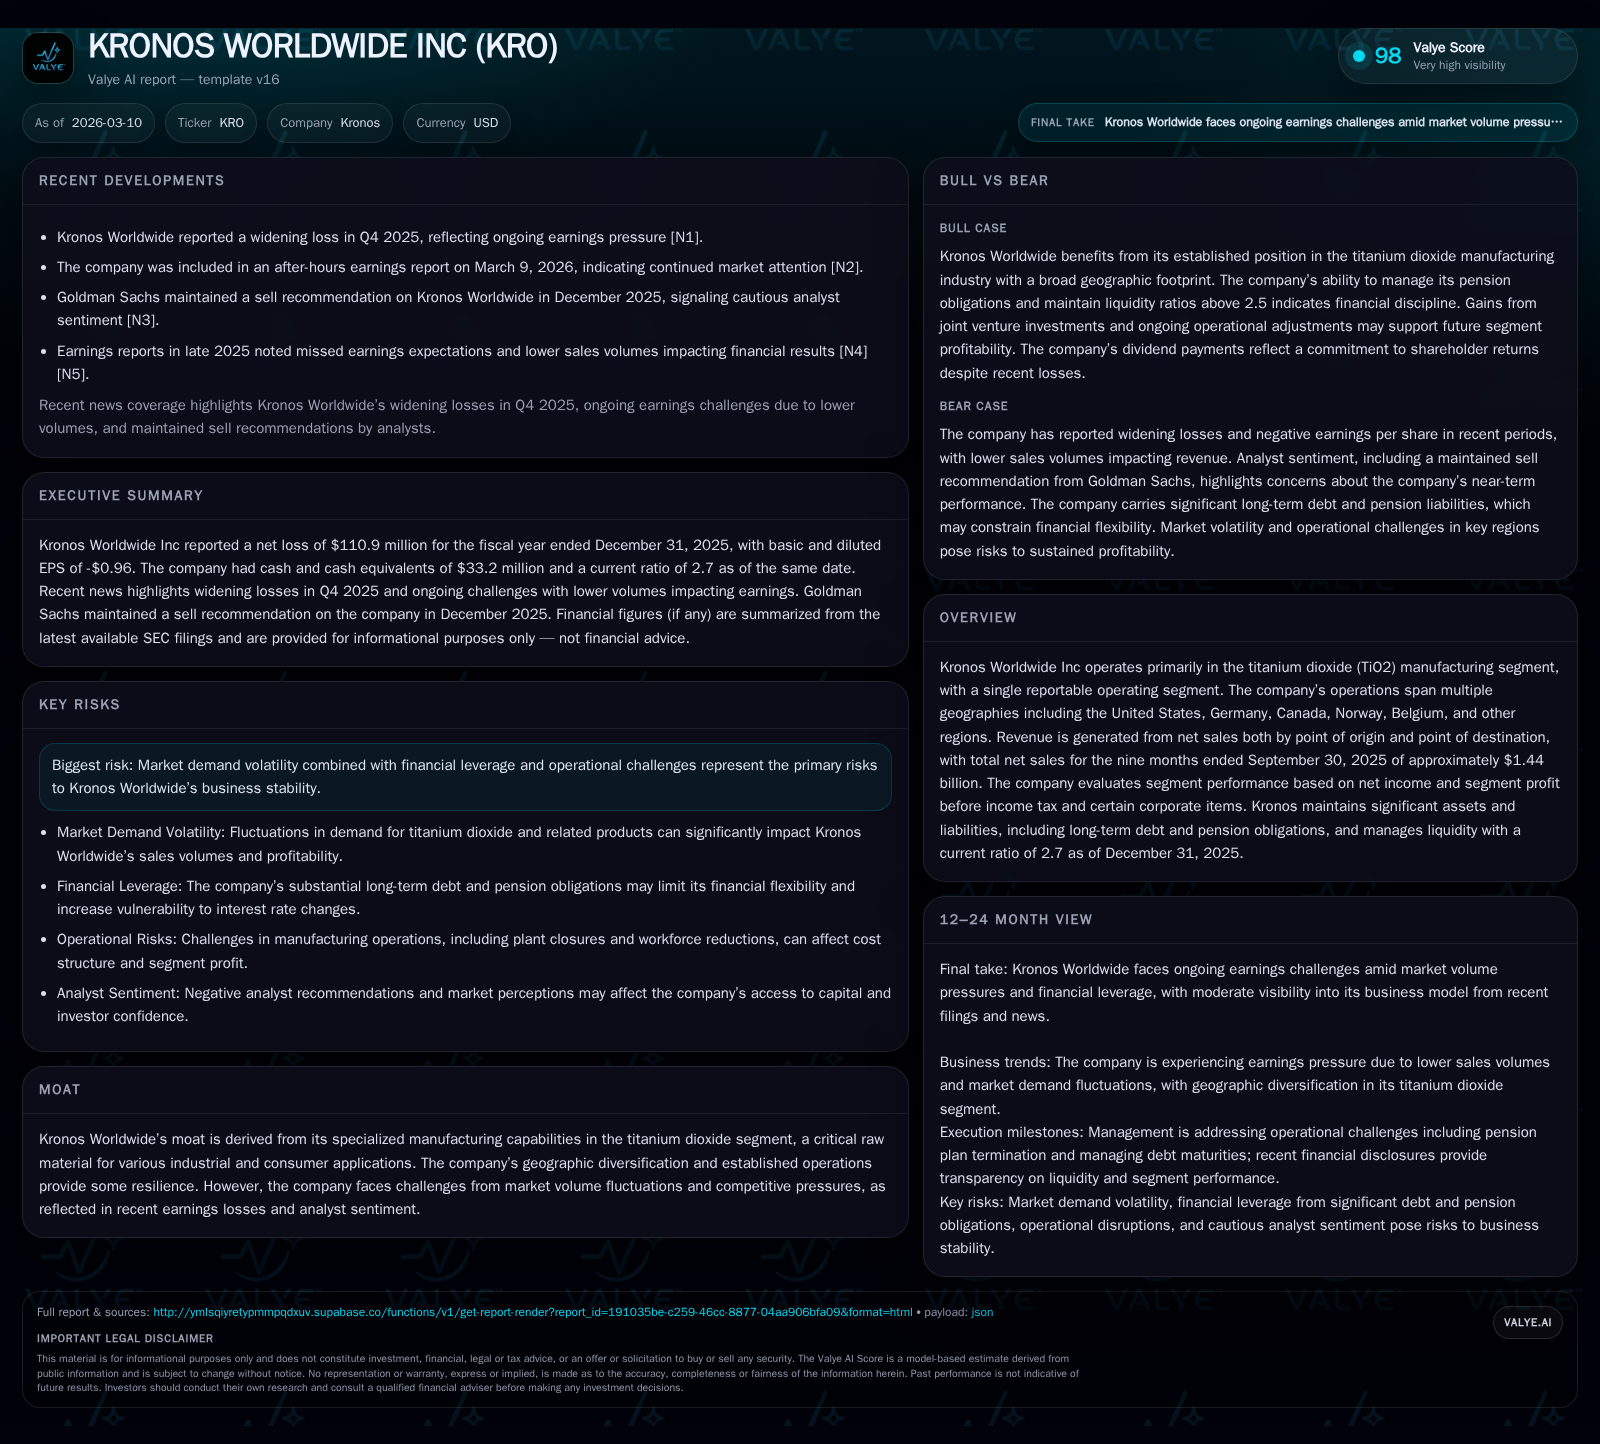
KRONOS Worldwide Inc, a key player in titanium dioxide (TiO2) manufacturing, faced severe financial setbacks in 2025 with an operating loss of $36.5 million and a net loss of $110.9 million, reversing the profit gains of the prior year. Despite stable revenue trends over recent years, earnings have fluctuated sharply due to market demand volatility and operational challenges. The company's liquidity profile remains solid with a current ratio of 2.7, yet capital expenditures increased substantially while free cash flow turned negative. Future growth hinges on managing competitive pressures and market volumes amid financial leverage constraints.
Company Overview and Market Position
KRONOS Worldwide Inc is primarily engaged in the production of titanium dioxide (TiO2), a critical pigment used widely in paints, plastics, paper, and specialty applications. The company's single reportable segment consolidates its efforts globally across multiple facilities notably in the United States, Germany, Canada, Norway, Belgium, and other regions [S1][S8]. Kronos claims a leading position in Europe, estimated as the largest TiO2 producer on that continent with around a 15% share of European sales volumes during 2025 [S1]. This geographic diversification provides revenue resilience but also exposes Kronos to complex regulatory environments and localized economic factors.
Historical Performance and Past Growth Drivers
Kronos’s reported revenues have shown some growth over the last few years, underpinned by demand rebounds and volume recoveries post-2020 [F1]. From $287 million in 2015 to roughly $453 million reported for 2017 (latest public top-line data), this trend reflects sectoral cyclicality aligned with industrial raw material markets.
However, profitability has been volatile: operating income swung sharply from positive figures such as $159.6 million in 2022 to losses like -$56 million in 2023 and again an operating loss of -$36.5 million in 2025 [F1]. Net income patterns mirror this instability with a loss widening to -$110.9 million in fiscal year 2025 after an $86.2 million profit a year earlier [F1]. Such swings are symptomatic of cost pressures, volatile raw material prices, regional demand shifts, and operational inefficiencies.
The company generated healthy operating cash flows historically—$81.7 million in 2022—yet the most recent year’s cash flow dropped precipitously to only $2.5 million despite revenue gains [F1]. Increased inventory levels and receivables contributed to working capital strains [S15][S22]. Capital expenditure commitments rose significantly by approximately 45% year-over-year reaching $42.9 million in FY2025 as Kronos invested in plant maintenance and capacity enhancements [F1][S15].
Financial Summary Table
Historical performance (annual)
| FY | Net ($mm) | CFO ($mm) | OpInc ($mm) | Capex ($mm) | Net YoY |
|---|---|---|---|---|---|
| 2025 | -111 | 3 | -36 | 43 | -228.7% |
| 2024 | 86 | 73 | 123 | 30 | +275.6% |
| 2023 | -49 | 6 | -56 | 47 | -147.0% |
| 2022 | 105 | 82 | 160 | 63 |
Source: SEC companyfacts cache [F1].
Capital returns and efficiency (annual)
| FY | Div ($mm) | Buybacks ($mm) | FCF ($mm) |
|---|---|---|---|
| 2025 | 23 | 3 | -40 |
| 2024 | 55 | 3 | 43 |
| 2023 | 88 | 3 | -42 |
| 2022 | 88 | 2 | 19 |
Source: SEC companyfacts cache [F1].
Note: Latest explicit fiscal period data per SEC filings; some metrics approximate based on reported quarterly figures [F1].
Current Financial Condition and Capital Structure
Kronos's balance sheet shows total current assets just under $1 billion against current liabilities around $369 million as of December end-2025 [F1], yielding a sound current ratio near 2.7 that supports liquidity comfort despite operational losses.
However, long-term debt expanded considerably reaching approximately $626 million by Q3-2025 due partly to refinancing €75 million senior secured notes at higher yields (9.5%) replacing maturing lower coupon notes [S4][S5]. The debt covenants remain intact but financial leverage is elevated relative to equity nearing $751 million at fiscal year-end [F1][S13]. Interest expense pressures contributed roughly $38.5 million annually recently [S15].
On the cash side, despite holding about $33 million cash equivalent by December end [F1], free cash flow turned negative by more than $40 million due to capital expenditure outlays exceeding operating inflows [F1][S15]. Dividend payments continue but were sharply curtailed recently from mid-$50+ millions prior years to approximately $23 million most recently [F1]. Share repurchases have been insignificant since no buys occurred in last two years though authorization remains for roughly one million shares repurchase capacity [S1].
Future Growth Prospects and Challenges
Growth moving forward hinges critically on market volume recovery for TiO2 pigments driven by end-market demand such as construction paints and high-value plastics usage across Europe and North America.
Operational improvements aiming at cost control amid input price volatility will be essential given past swings from profitability to losses within short spans [N2][S1]. Geographic diversification supports resilience but also complex supply chain management especially with notable exposures to currency fluctuations mitigated through forward contracts settled recently [S18][S25].
Financial leverage serves as an internal constraint limiting aggressive capital allocation plans beyond necessary capex and working capital.
Industry-wide titanium dioxide capacity expansions globally could pressure pricing further if demand softens; KRONOS’s specialized manufacturing capabilities provide moat protection but only partly buffer cyclical demand downturns.
Revenue-wise guidance is currently not explicitly provided; watching quarterly volumes sold into core markets alongside pricing trends will be key indicators for turning the corner toward renewed growth prospects [N1][N2].
Operational Highlights and Segment Dynamics
The company emphasizes evaluation on segment profit before taxes plus net income; single-segment reporting underscores dependence on the TiO2 business fundamentals exclusively rather than diversification benefits from other chemicals or materials sectors [S1][S8].
Recent joint venture investments enhance manufacturing footprint but earn-out liabilities were adjusted downward after failing milestone triggers in mid-2025 reflecting revised expectations on certain operational milestones [S12][S16]. This signals management adjustments consonant with prevailing macroeconomic headwinds.
Returns and Capital Allocation Strategy
Return on equity was approximately -14.8% for FY2025 calculated via net loss over average equity base per latest data points indicating negative value creation amidst heavy expenditure phase combined with weak earnings realization [F1].
Cash flow generation difficulties led to minimal discretionary returns; dividends continued albeit reduced while buybacks ceased pending stabilization.
Given the sharp deterioration in net income and operating profits juxtaposed with persistent high debt servicing costs (interest expense ~$38m annually), prudent capital stewardship will require prioritizing deleveraging once market conditions improve alongside cautious capex management rather than aggressive shareholder distributions currently.
Conclusion
KRONOS Worldwide entered calendar year-end fiscal periods in distressed earnings territory after benefiting from sporadic profit spikes over previous years within an inherently cyclical TiO2 industry framework. Market demand volatility combined with elevated leverage weighs heavily on profitability prospects near term.
Despite credible liquidity buffers reflected by strong current ratios coupled with strategic geographic operations spanning major industrial centers across the US and Europe, KRONOS faces operational headwinds tied to raw material costs, competition, and subdued industrial activity patterns impacting titanium dioxide volume sales.
Capital allocation remains conservative due to negative free cash flow conditions amid elevated interest burdens even as dividend pay-outs continue at lower levels without meaningful share repurchases underway.
Future monitoring should focus keenly on quarterly volume recoveries across core markets, pricing stability or improvement signals for TiO2 pigment products sold primarily through European channels alongside any shifts in financial leverage or cost structure optimization initiatives that might hint at upcoming earnings normalization.
This assessment eschews explicit investment recommendations but highlights material financial distress signals coupled with moderate growth potential contingent upon volatile commodity marketplace parameters shaping KRONOS's strategic trajectory going forward.
Disclaimer: This analysis is based solely on information publicly available from SEC filings up to March 10, 2026 ([F1], [S#]) and recent news reports ([N#]). It does not constitute investment advice or endorsement of any securities mentioned herein.
Disclaimer: This is research-only, informational analysis and not investment advice. It may include AI-generated interpretation and general industry context. Always verify important details using primary sources.
Comments