
BAB, Inc. Earnings Rise Despite Modest Revenue Decline and Franchise Contraction
BAB, Inc. shows operating income growth driven by operational efficiencies amid pressure on system-wide unit counts and royalties.
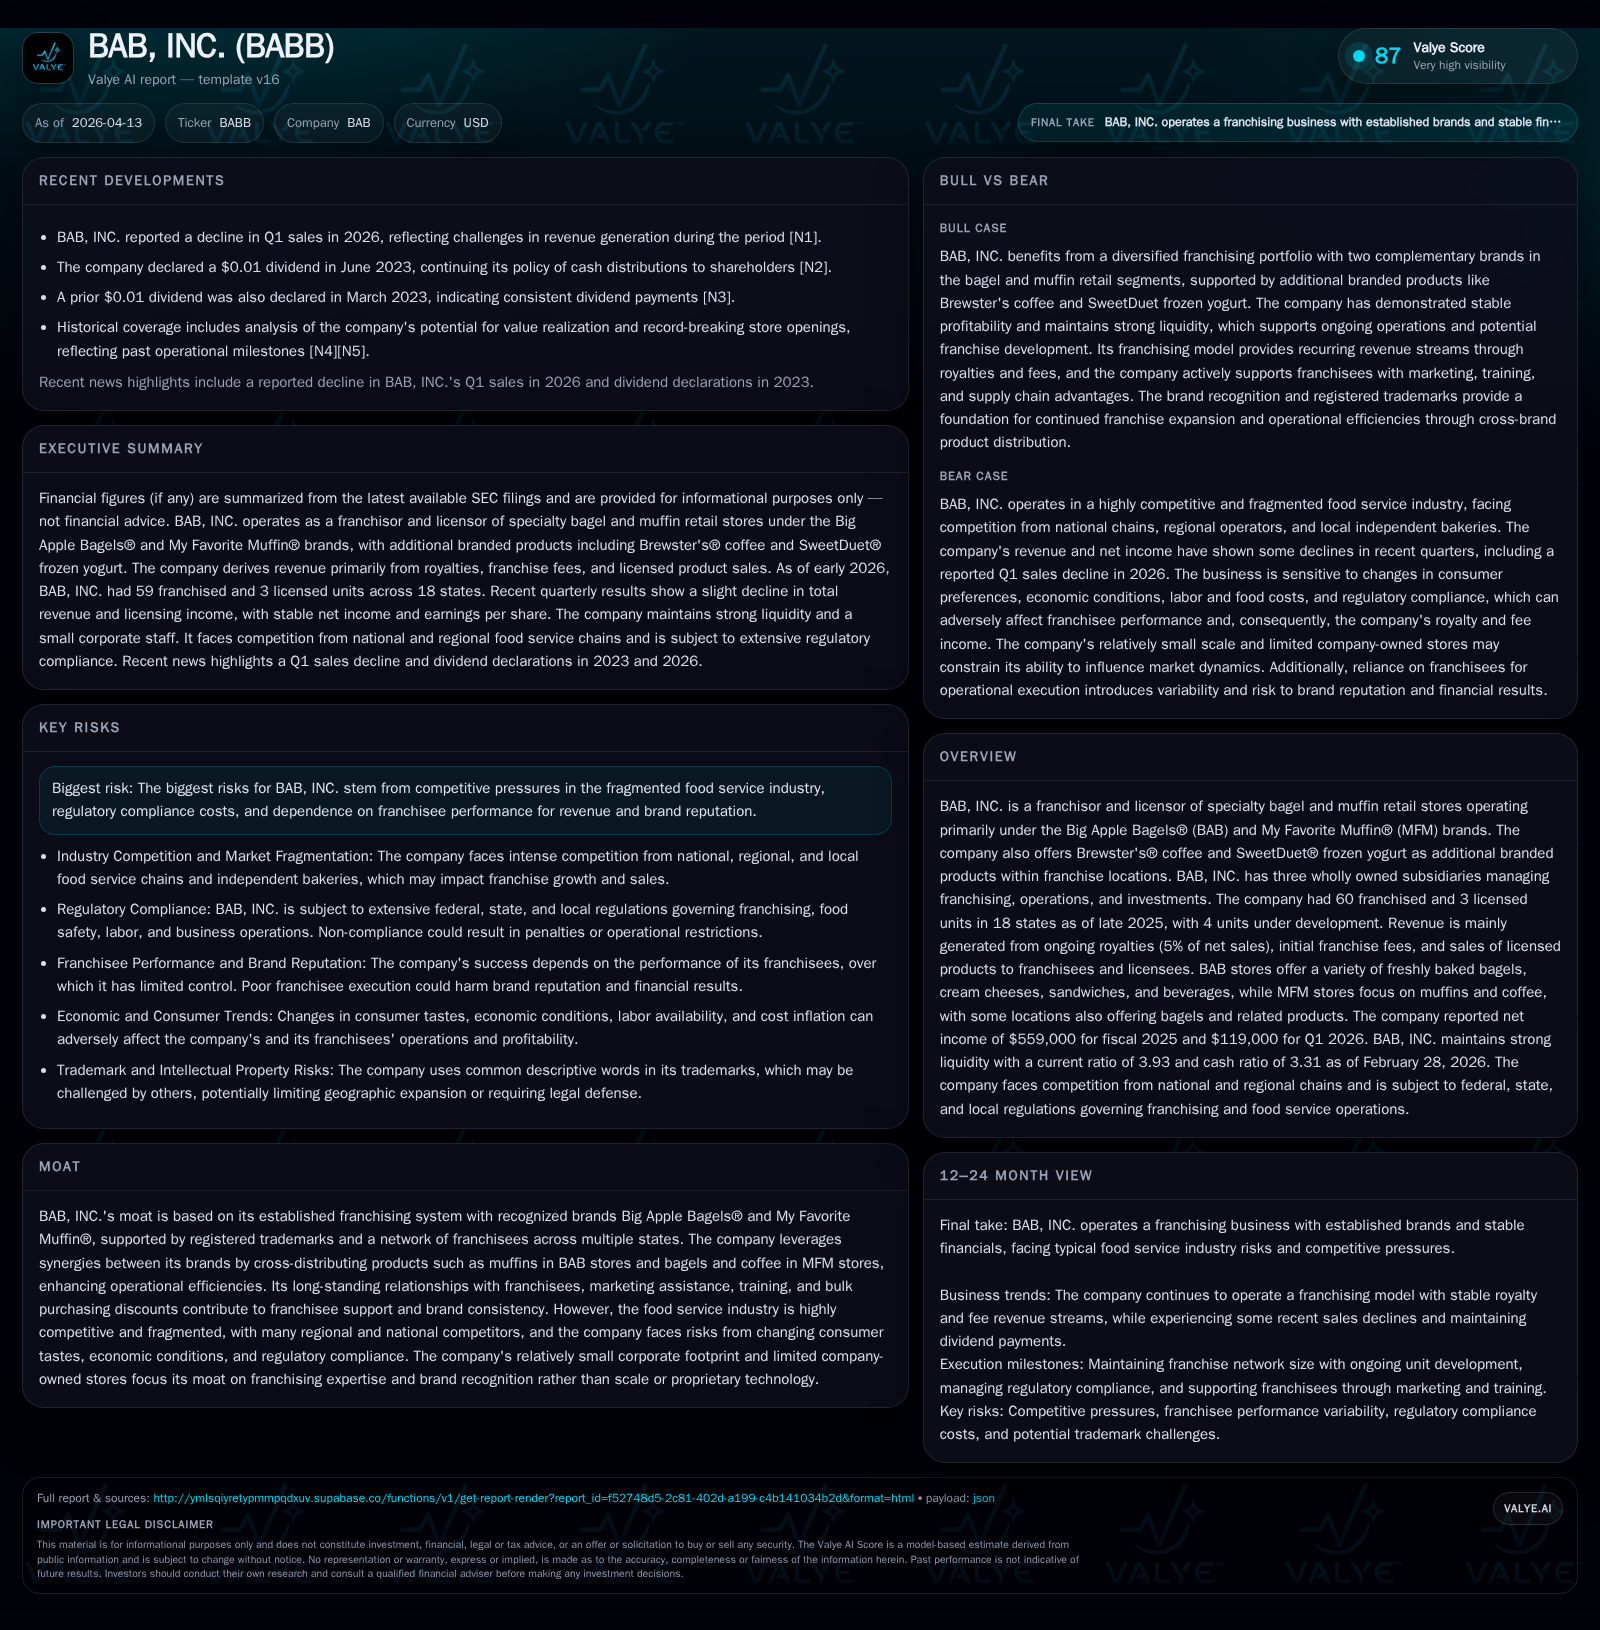
BAB, Inc., a franchisor of specialty bagel and muffin stores with brands Big Apple Bagels® and My Favorite Muffin®, reported a modest decline in revenues alongside increased operating income for fiscal 2025. The firm operates mostly through franchising with minimal company-owned stores and leverages brand synergies across product lines. Although the number of franchise units slightly decreased, BAB retains a strong cash position and has maintained steady dividend distributions. Key risks include competitive pressures in the fragmented food retail industry and dependence on franchisee performance.
Company Overview
BAB, Inc., incorporated in Delaware in 2000, franchises specialty retail stores under Big Apple Bagels® (BAB) and My Favorite Muffin® (MFM). It also offers ancillary branded products like Brewster's® coffee and SweetDuet® frozen yogurt within these locations [S1],[S13]. These brands operate primarily via franchises — there were about 60 franchised and 3 licensed units as of late 2025 distributed across 18 states with four additional units under development [S1],[S13].
The company's business model primarily generates revenues from ongoing royalties set at 5% of net franchise sales, initial franchise fees, and licensing fees related to branded product sales such as muffin mixes or coffee sold to franchisees [S1],[S2]. The franchise network fosters synergy by selling muffins in BAB locations and bagels plus coffee at MFM outlets, aiming for operational efficiencies [S1],[S6].
BAB maintains three wholly owned subsidiaries:
- Systems: Focused on franchising activities [S1]
- Operations: Historically operated company-owned stores but currently no stores are owned [S1]
- Investments: Established for acquisitions though none have yet occurred [S1]
Historical Financial Performance
From fiscal years ending November (except FY24 which ended December), BAB's revenue showed modest fluctuations with a slight downward trend recently:
Historical performance (annual)
| FY | Net ($) | CFO ($) | OpInc ($) | Net YoY |
|---|---|---|---|---|
| 2025 | 559044 | 414388 | 721632 | +6.4% |
| 2024 | 525200 | 637753 | 665294 | +12.4% |
| 2023 | 467321 | 534366 | 614773 | +8.2% |
| 2022 | 431992 | 135044 | 607767 |
Source: SEC companyfacts cache [F1].
Capital returns and efficiency (annual)
| FY | Div ($) | ROE% |
|---|---|---|
| 2025 | 435810 | 16.1 |
| 2024 | 363175 | 15.7 |
| 2023 | 363175 | 14.7 |
| 2022 | 290541 | 14.0 |
Source: SEC companyfacts cache [F1].
Operating income grew steadily despite slight revenue declines due largely to cost control and leveraging the franchising model’s lower fixed costs [F1],[S1]. Net income mirrors this positive margin trend.
Operating cash flow exhibited volatility—peaking in FY24 before declining by ~35% in FY25—reflecting working capital changes or timing effects without evidence of operational deterioration [F1]. Capital expenditures remain nominal historically.
BAB’s equity base grew moderately over recent years reaching $3.46 million by FY25 end against which net income reflects an approximate return on equity near 16%, indicative of efficient capital use within its asset-light franchising model [F1].
Store Footprint and Unit Trends
Franchise unit counts showed marginal contraction: from around 64 franchised plus four licensed locations in mid-2024 to approximately 59 franchised and three licensed units as of early Q1-2026 [S2],[S14],[S16]. System-wide revenues remained stable for comparable quarters but suffered slight declines reflecting fewer operating units (e.g., system-wide revenue ~$9.6 million for Q1-26 vs. $9.4 million for Q1-25) [S2],[N1].
While some closures or license expirations contributed to the reduced footprint, there are still four units under development aiming for pipeline growth [S1],[S14]. This contraction may reflect typical franchise turnover or competitive pressures within the foodservice industry.
Growth Prospects and Constraints
BAB’s growth strategy focuses on expanding its franchise base while leveraging brand synergies through cross-selling complementary products like Brewster’s coffee or SweetDuet frozen yogurt additions [S1],[S6]. Nontraditional distribution channels for licensed products also offer potential incremental revenue streams.
However, the company operates in a highly fragmented foodservice sector facing competition from national chains such as Panera Bread as well as supermarket bakery alternatives [S7]. Additional risks include rapid shifts in consumer preferences, economic variability impacting discretionary spending, wage regulation compliance costs affecting franchisees independently managed [S11],[S27].
Given BAB’s asset-light model focusing on franchising rather than direct store ownership limits capital needs but also reduces direct control over retail execution and profitability [S1],[S7], dependency on franchisee performance remains a critical factor.
Returns & Capital Allocation
BAB maintains disciplined capital allocation with consistent cash distributions/dividends increasing from $363K in FY24 to approximately $436K in FY25 despite softer operating cash flows; demonstrating confidence grounded in stable earnings and liquidity reserves [F1],[S10].
Liquidity remains strong with unrestricted cash exceeding $2.1 million as of February 28, 2026 alongside a healthy current ratio near 3.9x supporting short-term obligations comfortably [F1],[S8]. No material debt financing is noted indicating conservative balance sheet management.
Capital expenditures are minimal consistent with an asset-light franchise model—historical capex is negligible relative to overall financial scale [F1]. Return on equity stands near a robust ~16%, underscoring efficient use of equity capital within a low-risk royalty-based business framework.
Industry Context & Risks Summary
In the specialty bakery segment where fresh baked goods drive customer loyalty versus mass-produced alternatives found at supermarkets or larger chains like Dunkin', scaling nationally poses challenges due to regional tastes and competition saturation.
Multibrand crossover strategies such as BAB’s shared product offerings align with industry trends enhancing average transaction values through complementary categories.
Labor cost inflation following regulatory changes pressures margins broadly; smaller franchisors face elevated risks compared to larger peers who can leverage pricing power.
Key risks include:
- Reliance on franchisee operational success impacting royalty stream stability [S11],[S27]
- Regulatory compliance costs across multiple jurisdictions affecting franchise economics [S27]
- Potential brand dilution if isolated franchises underperform given limited corporate control over retail execution [S7]
- Competitive pressure from other specialty bakery chains and broader cafe beverage operators reducing market share potential [N1],[S7]
Final Assessment
BAB exhibits steady profitability growth amidst modest revenue declines linked mainly to reduced active franchise units. The company benefits from recognized trademarks with two decades of operation along with intertwined brand portfolios enhancing distribution efficiency. Challenges arise from industry fragmentation coupled with external risks tied to franchisee execution quality and regulatory environment complexities. Future success depends on effectively executing unit expansion plans while sustaining royalty base health through ongoing support programs and marketing initiatives. Financial metrics reflect cautious stability more than high-growth momentum within an intensely competitive niche; no acquisitions have been undertaken that might alter scale dynamics significantly.[F1][N1]
Disclaimer: This analysis is based solely on publicly available SEC filings dated through April 13th,2026,Nasdaq news commentary,and verified financial data extracted therefrom.It does not constitute investment advice nor recommendations.
Disclaimer: This is research-only, informational analysis and not investment advice. It may include AI-generated interpretation and general industry context. Always verify important details using primary sources.
Comments