
Brookfield Business Corp’s Revenue Decline and Leverage Highlight Capital Allocation Challenges
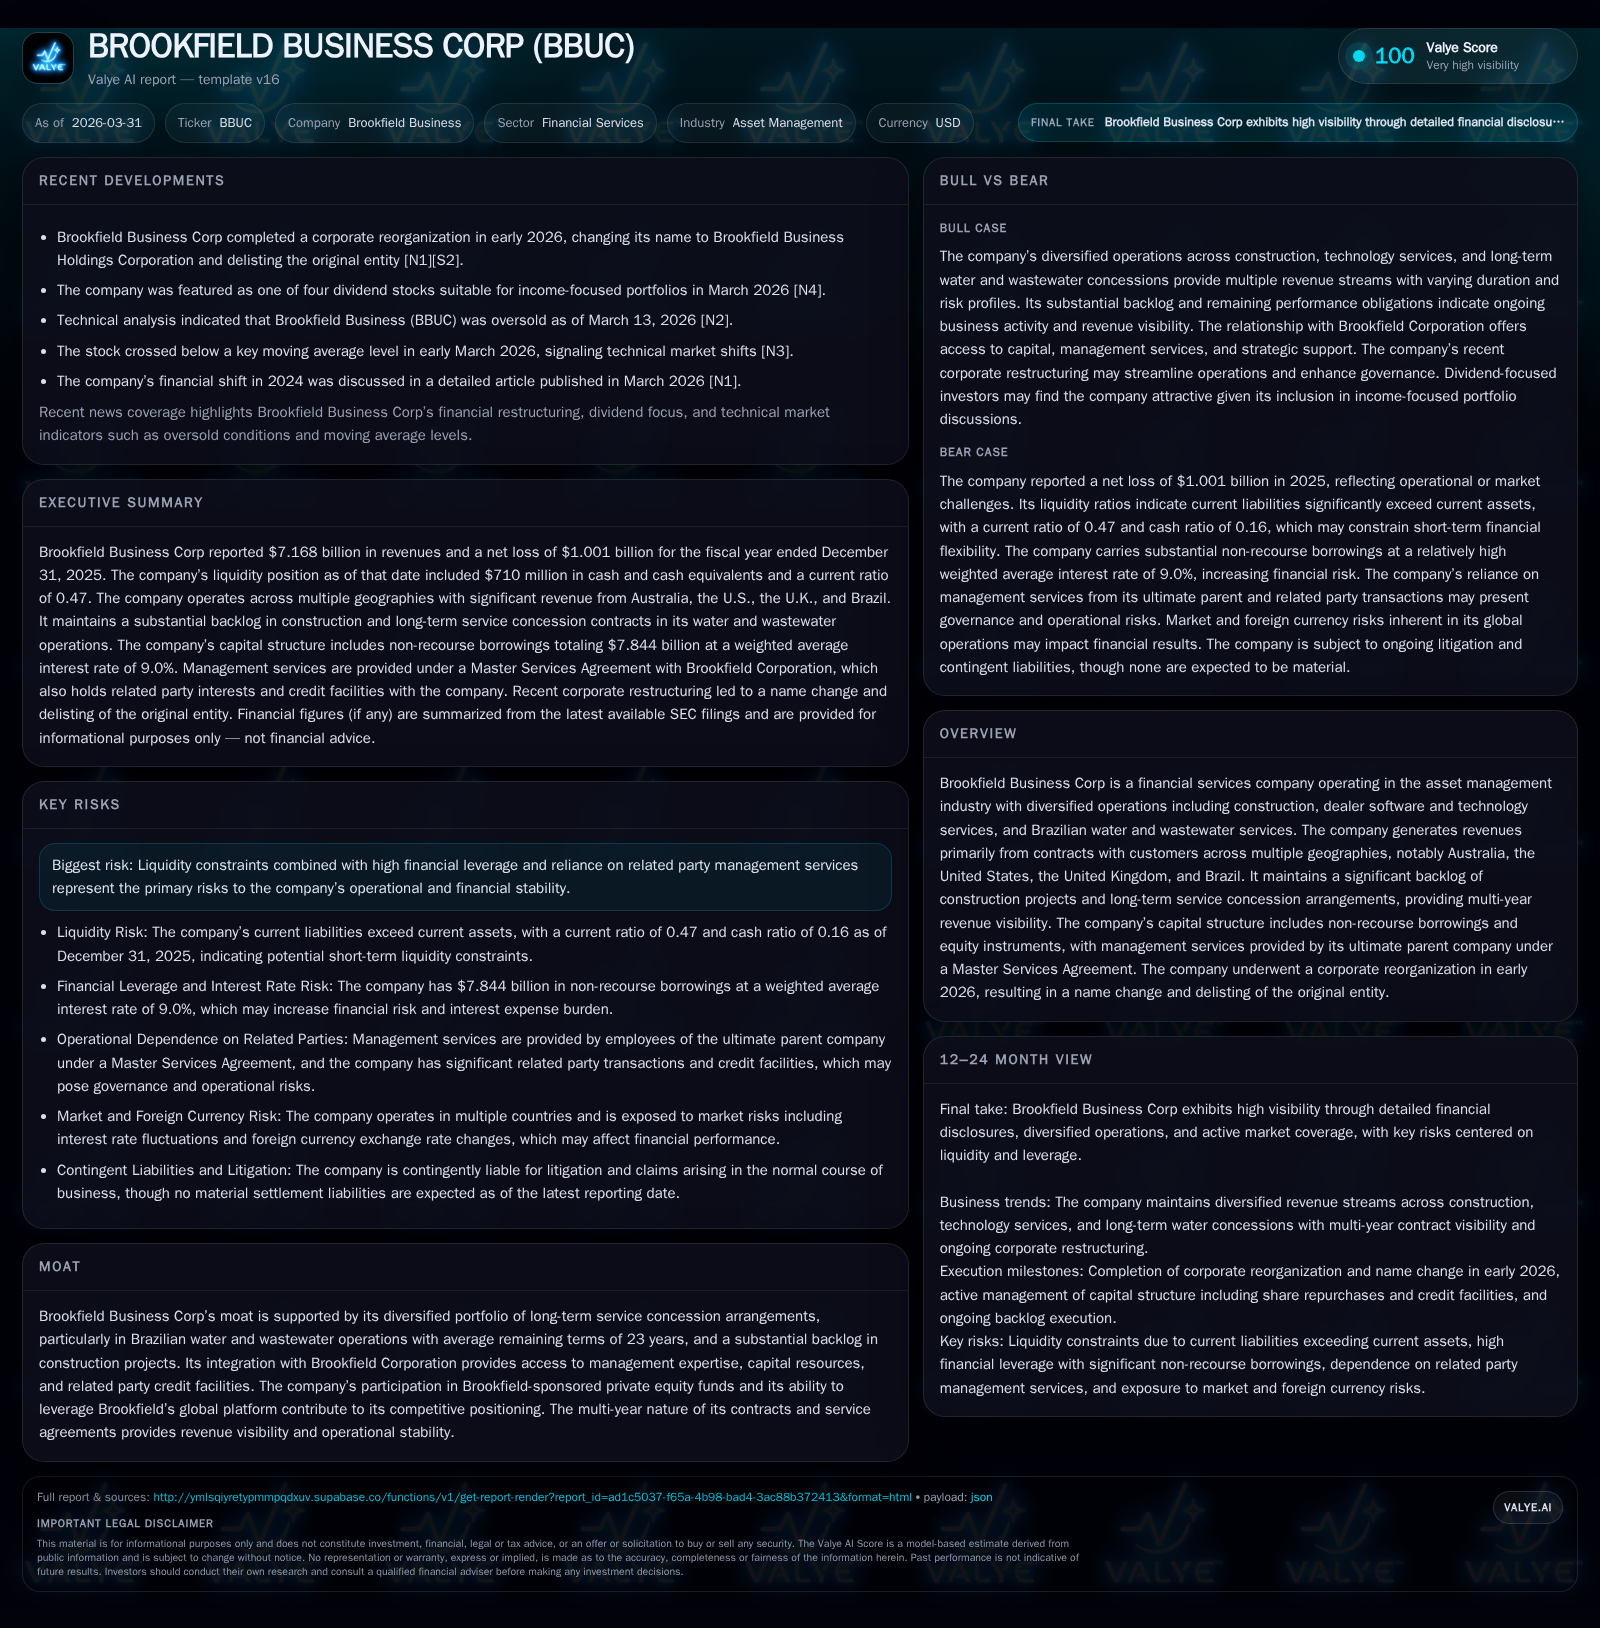
Brookfield Business Corp's 2025 results show revenue contraction and ongoing net losses amid a complex capital structure, substantial leverage, and reliance on related-party management services.
Brookfield Business Corp reported a 12.7% decline in revenue to $7.17 billion in 2025, with net losses narrowing to $1 billion. The company’s operations include long-term service concessions, particularly in Brazilian water services, providing multi-year revenue visibility. High leverage persists with a net debt-to-capital ratio of approximately 77%. Capital allocation in 2025 prioritized share repurchases and dividends aligned with unit distributions despite losses. Following corporate restructuring, exchangeable shares were delisted from public markets in early 2026.
Historical Performance Trends
Brookfield Business Corp operates across multiple geographies including Australia, U.S., U.K., and Brazil with diversified revenue streams such as construction projects, dealer technology services, and regulated water operations in Brazil [S25]. In fiscal 2025, revenue declined by nearly 13% year-over-year to approximately $7.17 billion from $8.21 billion in fiscal 2024 as per SEC XBRL data [F1]. This follows a downward trend after a peak near $10.6 billion in FY22.
Net income remained negative with a loss of approximately $1 billion in FY25—an improvement from the $1.93 billion loss in FY24 but still reflecting operational challenges [F1]. This translated into an approximate negative return on equity of -47.7%, highlighting ongoing capital erosion despite equity levels above $2 billion at year-end [F1].
The business benefits from long-term concession contracts averaging over two decades, especially within Brazil's water/wastewater sector, offering multi-year revenue visibility that cushions against cyclicality though not eliminating it entirely [S25].
Historical performance (annual)
| FY | Rev ($bn) | Net ($bn) | Rev YoY | Net YoY |
|---|---|---|---|---|
| 2025 | 7.2 | -1.0 | -12.7% | +48.1% |
| 2024 | 8.2 | -1.9 | +6.8% | -168.1% |
| 2023 | 7.7 | 2.8 | -27.5% | +162.9% |
| 2022 | 10.6 | 1.1 |
Source: SEC companyfacts cache [F1].
Capital returns and efficiency (annual)
| FY | ROE% |
|---|---|
| 2025 | -47.7 |
| 2024 | -73.1 |
| 2023 | 59.4 |
| 2022 | 26.4 |
Source: SEC companyfacts cache [F1].
Figures rounded; source: SEC filings & XBRL data
Capital Structure & Liquidity Position
The company’s capital structure is characterized by significant non-recourse borrowings at subsidiary levels totaling approximately $7.84 billion at December 31, 2025, slightly down from prior years but sustaining a high leverage profile relative to total capital of about $9.2 billion, yielding a net debt-to-capital ratio around 77% [F1][S3][S12].
Borrowings are diversified by currency with USD-denominated debt largest ($5.77B), followed by Brazilian real borrowings ($2.07B), while Australian dollar debt was eliminated by year-end reflecting strategic positioning [S3]. Interest costs are managed through derivatives maintaining an average weighted interest rate near 9% [S6].
Liquidity management focuses on meeting operating needs, scheduled debt repayments, maintenance capital expenditures, and acquisition funding supported by credit lines and equity commitments from Brookfield Business Partners up to $2 billion under defined conditions [S3][S4][S6].
Cash and equivalents stood at approximately $710 million at year-end while current liabilities significantly exceeded current assets resulting in a current ratio near 0.47, indicating tight short-term liquidity requiring careful management [F1]. Related party credit facilities facilitate cash flow flexibility within the group [S6][S7].
Operational Integration & Management Services
Brookfield Business Corp’s operations are integrated within the broader Brookfield platform via a Master Services Agreement under which management services are provided by Brookfield Corporation [S6][S13]. This arrangement grants operational synergies and access to capital markets yet introduces governance dependencies and associated costs.
Base management fees increased year-over-year consistent with entity capitalization growth and are recorded as general administrative expenses impacting margins directly [S6]. This model supports oversight across diverse global operations but necessitates balancing centralized control with operational autonomy.
Capital Allocation Patterns
Despite sustained losses during FY24-FY25, the company pursued active capital return strategies including share repurchases authorized through normal course issuer bids exceeding three million exchangeable shares repurchased during FY25 plus continued activity into early FY26 [S5]. Dividends are structured equivalently to distributions on units with cumulative features prioritizing exchangeable shareholders over class C shareholders ensuring income continuity amid earnings pressures [S8][S10].
This approach suggests confidence by management or parent entities regarding intrinsic value preservation but may strain financial flexibility if losses persist.
Future Outlook & Growth Drivers
Growth prospects hinge on backlog conversion into revenues primarily via construction projects worldwide and stable recurring revenues from long-term infrastructure concessions concentrated especially within Brazil’s water sector where contracts average roughly twenty-three years remaining term providing durable revenue streams [S25].
Additionally, co-investment alongside institutional investors through Brookfield-sponsored private equity funds targeting complementary acquisitions offers potential expansion subject to investment criteria meeting cost-of-capital hurdles [S6].
Key upcoming milestones include:
- Execution progress converting backlog into revenues;
- Renewals or amendments of Brazilian concession contracts;
- Impact of corporate restructuring post-2026 delisting on investor relations;
- Capital raising initiatives via asset sales or equity issuance aligned with return expectations;
- Operational efficiency improvements aimed at reducing net losses toward breakeven.
Following the March 2026 restructuring, exchangeable shares were delisted from NYSE and TSX altering public market dynamics for the company’s securities [N1][N3][S1][S2][S23].
Risks: Leverage & Liquidity Constraints
High leverage remains a critical risk factor; net debt-to-capital ratios near four-fifths limit financial headroom requiring disciplined cash flow management especially amid sequential revenue declines impacting earnings negatively over multiple years [F1][S3][S19]. Short-term liquidity risk is accentuated by current assets below current liabilities with a current ratio below one necessitating vigilant working capital oversight.
Operational reliance on third-party managed IT systems introduces cybersecurity risks mitigated through governance frameworks including dedicated committees led by experienced CISOs; however, cyber threats remain an ongoing concern requiring continuous monitoring and investment [S1].[N2]
Foreign currency exposures exist due to geographic diversification across USD-, BRL-, and AUD-denominated operations; these risks have been partially mitigated through reductions in foreign exchange contracts during 2025 compared to prior periods [S12].
Summary Considerations
Brookfield Business Corp presents a complex profile combining defensible infrastructure assets supported by long-term concession contracts and backlog pipelines providing mid-term revenue clarity alongside challenges from declining top-line performance and persistent net losses compounded by elevated leverage imposing liquidity stress.
Capital deployment favors shareholder returns through buybacks and dividends despite earnings pressures underscoring significant backing from parent Brookfield entities via committed credit lines and intra-group liquidity arrangements.
Future success depends on effective backlog execution translating into profitable cash flows aligned with evolving debt maturity profiles while navigating regulatory environments governing concessions and managing geopolitical risks inherent in its international footprint.
This analysis is based solely on publicly available information including SEC filings dated March 31, 2026 ([F1], [S1]-[S28]) and recent news articles ([N1]-[N4]). It does not constitute investment advice or recommendations.
Disclaimer: This is research-only, informational analysis and not investment advice. It may include AI-generated interpretation and general industry context. Always verify important details using primary sources.
Comments