
BW LPG Ltd Reports Growth Setbacks and Strategic Fleet Expansion
BW LPG's 2025 financial results reveal revenue growth tempered by profit pressures alongside a strategic fleet enlargement.
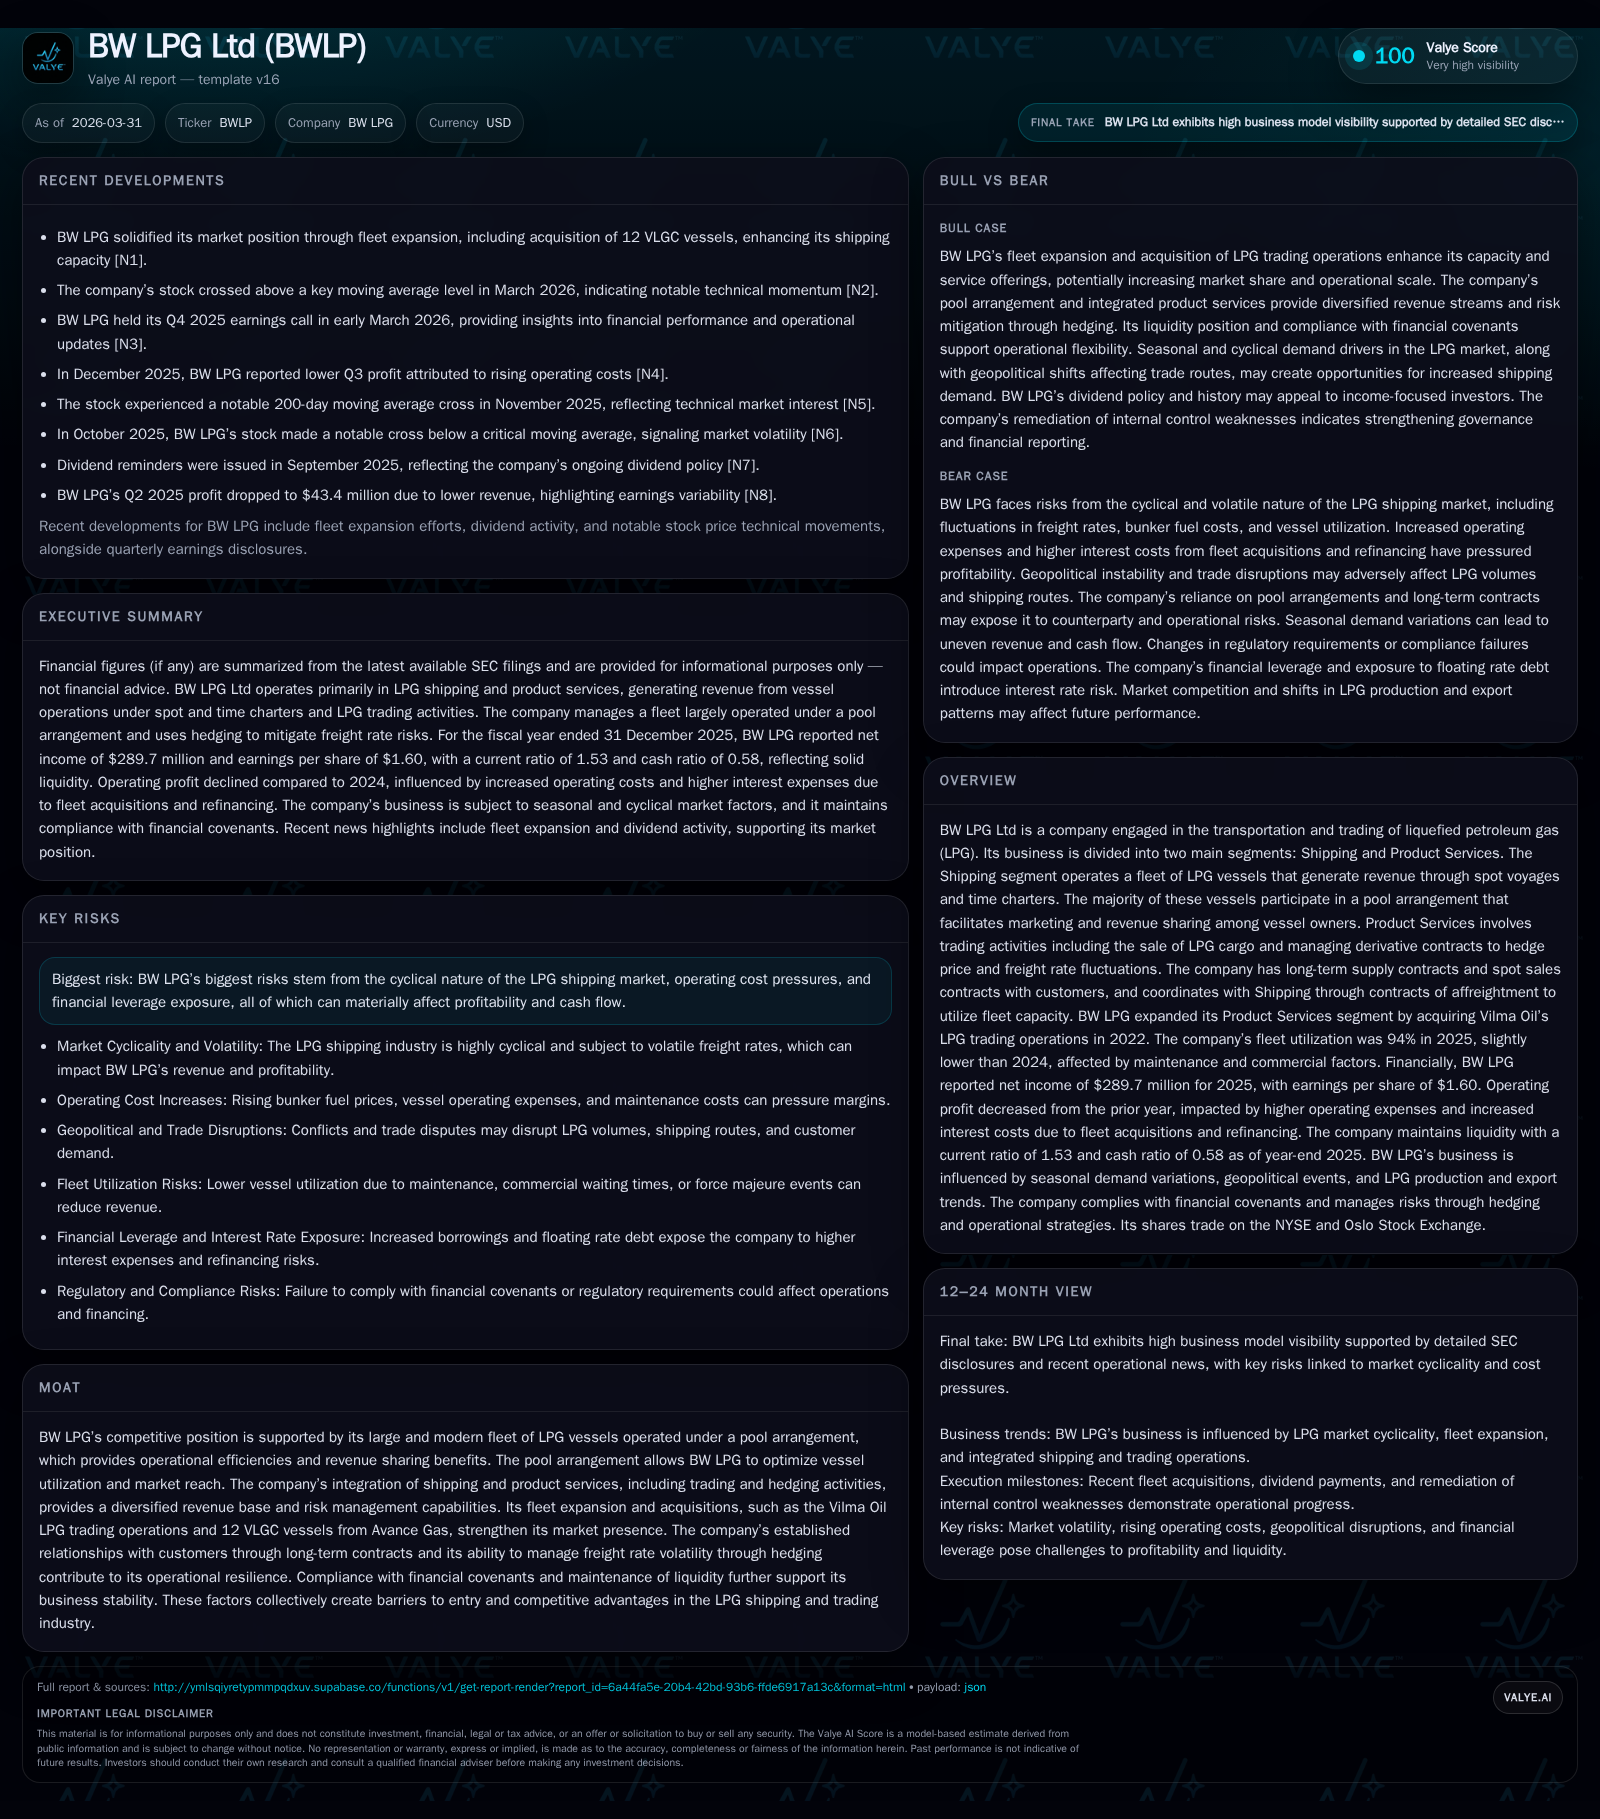
In 2025, BW LPG Ltd expanded its fleet significantly but encountered declining net income and compressed profit margins. The company’s dual-segment model—comprising Shipping and Product Services—continued to underpin its revenue base, with the Shipping segment benefiting from strong vessel utilization. However, rising operating costs and freight market cyclicality dampened profitability. Capital allocation remained disciplined as dividends were maintained while free cash flow improved despite lower net income. Looking forward, BW LPG's integration of new vessels and product trading acquisitions aims to bolster its market resilience amid ongoing sector volatility.
Overview: Dual Segments Driving BW LPG’s Core Business Model
BW LPG Ltd operates primarily through two intertwined segments: Shipping and Product Services. The Shipping segment manages a fleet of very large gas carriers (VLGCs) that transport liquefied petroleum gas (LPG), generating revenues via spot voyages and time charters. A distinctive feature is the company’s participation in a pool arrangement pooling owned and chartered-in vessels — a common industry mechanism that enhances operational efficiency through consolidated marketing, scheduling, and revenue distribution among participants [F1][S1]. This pool strategy not only increases vessel utilization but also mitigates individual shipowner exposure to price volatility.
The Product Services segment engages in LPG cargo trading and hedging activities. It holds long-term supply contracts as well as spot sales agreements with customers, often coordinating convoyed shipments through contracts of affreightment with the Shipping arm. This vertical integration balances exposure between physical delivery logistics and market price dynamics, while derivative contracts help manage fluctuations in LPG prices and freight rates [S13][S14]. In November 2022, BW LPG augmented this segment’s scale through acquiring Vilma Oil's LPG trading business, deepening its market penetration [N2]. Together, these segments create a synergistic platform supporting the company's broad value chain across transport and commodity management.
Historical Financial Performance: Revenue Gains Shadowed by Profit Pressures
BW LPG’s financial performance over fiscal years 2024 and 2025 demonstrates expanding top-line figures offset by tighter margins due to cost pressures.
Historical performance (annual)
| FY | Net ($mm) | Net YoY |
|---|---|---|
| 2025 | 290 | -26.6% |
| 2024 | 395 |
Source: SEC companyfacts cache [F1].
Capital returns and efficiency (annual)
| FY | Div ($mm) | ROE% |
|---|---|---|
| 2025 | 241 | 15.0 |
| 2024 | 410 | 20.4 |
Source: SEC companyfacts cache [F1].
Shipping revenues rose by about $53 million (5.5%) driven largely by increased calendar days reflecting fleet additions (from ~12,833 total calendar days in ‘24 to ~16,402 in ‘25). However, Time Charter Equivalent (TCE) income per available day declined from $48.3k to $45k reflecting moderate rate softness amidst volatile seasonal demand [F1][S1]. On the Product Services front, revenues decreased marginally by around $34 million as weaker spot sales partially offset steady long-term contracts.
Operating profit declined approximately $85 million (-20%), predominantly due to sharp rises in vessel operating expenses (+49% YoY). This surge aligns with expanded drydock requirements on newer/upgraded ships and inflationary impacts on crew wages, fuel surcharges not fully recovered in freight rates, as well as higher voyage expenses linked to longer average trip lengths [S17]. The depreciation expense also jumped notably following acquisitions.
Net income contracted more than operating profit — down roughly $105 million or -26% — impacted additionally by a near fivefold increase in finance expenses owing to greater borrowings related to fleet purchases and working capital needs [S4][F1]. Despite this, foreign exchange effects provided modest relief with a net gain versus prior net loss.
Operational Drivers Behind Shipping and Product Services Segments
Fleet utilization remained robust at about 94% for vessels under BW LPG’s control during the latest period [N2][F1]. Acquisition of the full set of twelve VLGCs from Avance Gas expanded owned capacity materially during mid-2024 through early-2025, boosting calendar days available for contracts [N2]. Moreover, the company completed purchases of two additional secondhand VLGCs that complemented core assets.
On the revenue quality side, Time Charter Equivalent (TCE) rates per calendar day softened somewhat during the year — an outcome symptomatic of freight market cyclicality where aggressive supply growth presses charter rates lower despite underlying demand growth for LPG hauling services amid geopolitically reshaped trade routes [S16][N3]. Voyage expenses slightly normalized versus prior periods but continue representing an elevated share of total costs due to fuel price volatility.
Product Services volume dynamics reflected the integration of Vilma Oil's acquired LPG trading business starting late-2022 contributing incremental cargo handling scope but faced margin compression attributable to tightening spreads between physical LPG prices and derivatives markets used for hedging [S13][N2]. The segment’s hedging practices effectively reduce cash flow volatility yet entail mark-to-market gains/losses recognized each period that can obscure underlying trading income trends.
Market Positioning Through Fleet Modernization and Pool Arrangements
BW LPG operates one of the world’s largest specialized fleets consisting notably of modern dual-fuel VLGCs equipped with LNG-capable propulsion technology serving environmental regulations while enhancing fuel efficiency—a growing competitive differentiator given evolving IMO-emission standards [F1][S1].
Its participation in a pool arrangement allows optimized vessel deployment schedules reducing idle time across varying market conditions while distributing earnings in alignment with vessel contribution metrics [S14]. This fleet pooling mechanism facilitates stronger negotiation positioning with charterers enabling more stable freight pricing.
From a risk management perspective, the integrated hedge programs combined with contractual arrangements such as fixed-rate time charters or contracts of affreightment provide effective buffers against freight rate swings which are notorious within bulk shipping sectors like LPG transport [S14]. Procurement strategies aimed at ensuring compliance for fuel types used aboard also underscore operational foresight related to sustainability mandates shaping future barriers to entry.
Strategic Acquisitions and Their Impact on Product Services Expansion
The November 2022 acquisition of Vilma Oil's LPG trading operations significantly enhanced BW LPG’s Product Services hotbed offering additional scale with volume diversification across geographic nodes important for Asian markets [N2][F1]. This move is designed partly as a hedge against spot market volatility prevalent in shipping earnings by anchoring revenues through stable commodity flows underpinned by derivative hedge management.
While this expansion bolstered gross profits potential within Product Services historically subject to large unrealized gains/losses tied to contract fair value adjustments on cargo volumes and derivatives positions [S13], FY2025 results indicated gross profits contraction pointing towards episodic adverse market repricing cycles affecting realized margins.
Nonetheless, broadening portfolio risk mitigation via contractual diversity between physical cargo sales contracts (spot/long-term) coupled with layered derivative instruments remains vital for moderating earnings volatility patterns common among traders operating across multiple jurisdictions.
Current Financial Health: Capital Structure, Liquidity, and Risks
As at December 31, 2025 BW LPG maintained strong liquidity metrics: current assets vastly exceeded current liabilities translating into a healthy current ratio near 1.53 indicative of sound short-term solvency fundamentals [F1]. Cash and equivalents stood at $242 million providing ample buffer for immediate working capital needs.
Capital structure reflects substantial indebtedness attributable mostly to term loans secured for VLGC acquisition financing including facilities up to $460 million revolving credit facility expiring November ‘31 along with term loans maturing up to September ‘32 [S4][S6]. Total borrowings drawn under respective facilities amounted largely near their limits with interest rates primed around SOFR plus margins ranging from approximately +1.20%–1.40%. Use of interest rate swaps covering ~$200 million notional amount reduces variability related to floating-rate debt exposures enhancing predictability for finance costs over medium horizon [S4].
The Group remains compliant with all lender-imposed covenants focused on adjusted equity thresholds above $350m levels alongside minimum liquidity floors measured quarterly ensuring creditor confidence [S9]. Trade finance facilities totaling nearly $800 million support Product Services commodity flows secured against cargo collateral underpinning short-term funding flexibility important amid fluctuating commodity market requirements [S6].
Risks persist primarily from inherent LPG shipping cyclicality involving periods of oversupply causing charter rate erosion; operational cost escalations particularly crew wages/fuel; plus leverage-related refinancing risk should vessel valuations weaken prompting collateral calls or early repayments under loan terms restricting capital agility [S18][S19].
Capital Allocation: Dividend Policy and Return on Equity Analysis
BW LPG preserved its shareholder return commitment paying out dividends totaling approximately $241 million during FY2025—a notable reduction from almost $410 million paid in FY2024 consistent with net income contraction yet illustrating payout discipline aligned with earnings variability [F1][S11].
No material share buybacks followed completion of a modest buyback campaign capped at $20 million terminated in April ’25 indicating preference for conserving balance sheet strength amidst fleet investment cycles.
Calculation based on latest reported figures derives an approximate Return on Equity near 15%, down from over 22% previously reflecting profitability headwinds but maintaining reasonable capital productivity relative to asset-heavy shipping model characteristics [F1][S20]. Such ROE levels compare respectably within specialized shipping peers given global trade sensitivities impacting asset turnover ratios.
Outlook and Key Milestones: Observing Fleet Utilization and Market Indicators
Explicit forward-looking guidance was not articulated per recent disclosures ([N1]). Nonetheless monitoring key operational KPIs is critical:
- Tracking TCE rates trends remains essential as these encapsulate freight rate environment dynamics that influence core shipping earnings.
- Completion timing and commercial deployment status of newly acquired or secondhand VLGCs will impact calendar days available scaling revenue potential further post-2025 acquisitions ([N2]).
- Monitoring geopolitical developments affecting major trade routes such as Strait of Hormuz disruptions or Red Sea corridor security incidents will influence voyage expenses and scheduling efficiencies ([S16]).
- Freight market sentiment indicators including spot rate indices monitored post technical breakout events may inform cyclical turn assessments ([N3]).
- Product Services trading margin recovery hinges on global LPG demand sustainability particularly within Asia where PDH capacity expansions underpin import growth forecasts ([S16]).
Management continues emphasizing liquidity preservation strategies while seeking selective acquisition opportunities potentially funded through existing credit facilities aligned with long-term growth ambitions while balancing exposure messaging against volatile macro trade backdrops ([S8][N2]).
This memo synthesizes publicly available financial data extracted through regulatory filings combined with recent public news disclosures on BW LPG Ltd up to March/April 2026 without extrapolation beyond stated figures or speculative forecasts. All discussed metrics reflect reported accounting measures adhering strictly to IFRS standards outlined by BW LPG Limited governance documentation.
Disclaimer: This is research-only, informational analysis and not investment advice. It may include AI-generated interpretation and general industry context. Always verify important details using primary sources.
Comments